Driblab has a differential tool: we can measure the off-ball movements of footballers. We don't fall short with the adjective: the difference between knowing or not knowing what the 21 players who don't have the ball are doing is brutal.
You already know this, if you're a regular reader of our blog. You know we have seven types of off-ball runs based on a series of variables. You're familiar with classics such as Runs In Behind the defensive line or Support Runs, but also with more modern ones like Underlapping Runs and Cross Receiver Runs.
Obviously, you also know that Driblab can calculate all of this thanks to its in-house Tracking system.
However, there are surely some things that you, avid readers of our blog, don't know. Today we're talking about that, about the unknown, and we're conducting research to see to what extent this specific data informs us about the player profiles on a pitch.
What is the most repeated off-ball movement?
We're at the end of the season and we count 1,431 footballers with more than a thousand minutes played in any of the top five leagues. That makes a total of more than 360,000 off-ball runs. Only those that Driblab considers effective and of value, because there are others that aren't relevant for the analysis.
Among our seven categories, there is one type of movement that takes the crown: Runs Ahead of the Ball. This may sound like an enormous obviousness, but considering that teams spend more and more time with the ball in low areas, there are increasingly more opportunities for movements ahead of the ball to happen.
Let's define them, even tho they're a broad group that could be subcategorised (work in process): Runs Ahead of the Ball are runs in which a player starts ahead of the ball carrier and whose movement makes them move vertically away from the ball – that is, they gain height – but never actually go beyond the defensive line.
If they did, we'd be talking about the second most repeated movement: Runs In Behind the defensive line. These account for 17% of the total. Far from the 42% of Runs Ahead of the Ball, the most common type of run.
As we can see in the image, Support Runs (16%) and Coming Short Runs (15%) are the next ones in terms of prominence. The first ones consider that movement in which the player without the ball aligns with the carrier coming from behind with a movement that, for the most part, reduces the distance to the carrier to less than five metres and doesn't surpass them.
On the other hand, Coming Short Runs are those in which the player without the ball moves away from the opposition goal to get closer to the ball carrier. Both are movements of clearly associative nature and reduced distance.
Below 10% we find Underlapping Runs, those in which the player starts behind the ball carrier and surpasses them to receive. They can occur in the central channel or in the wide channels. If they take place in the central channel, the side on which the carrier is surpassed is irrelevant. In the wide channels, however, it's only considered an Underlapping Run when the player without the ball surpasses the carrier on the side closest to the centre circle.
The last two are Cross Receiver Runs (a player makes a run towards the opposition box and receives a cross) and Overlapping Runs (these only occur in the wide channels and when the player starts behind and surpasses the carrier on the side closest to the touchline). All of these are more specialised and tied to specific positions.
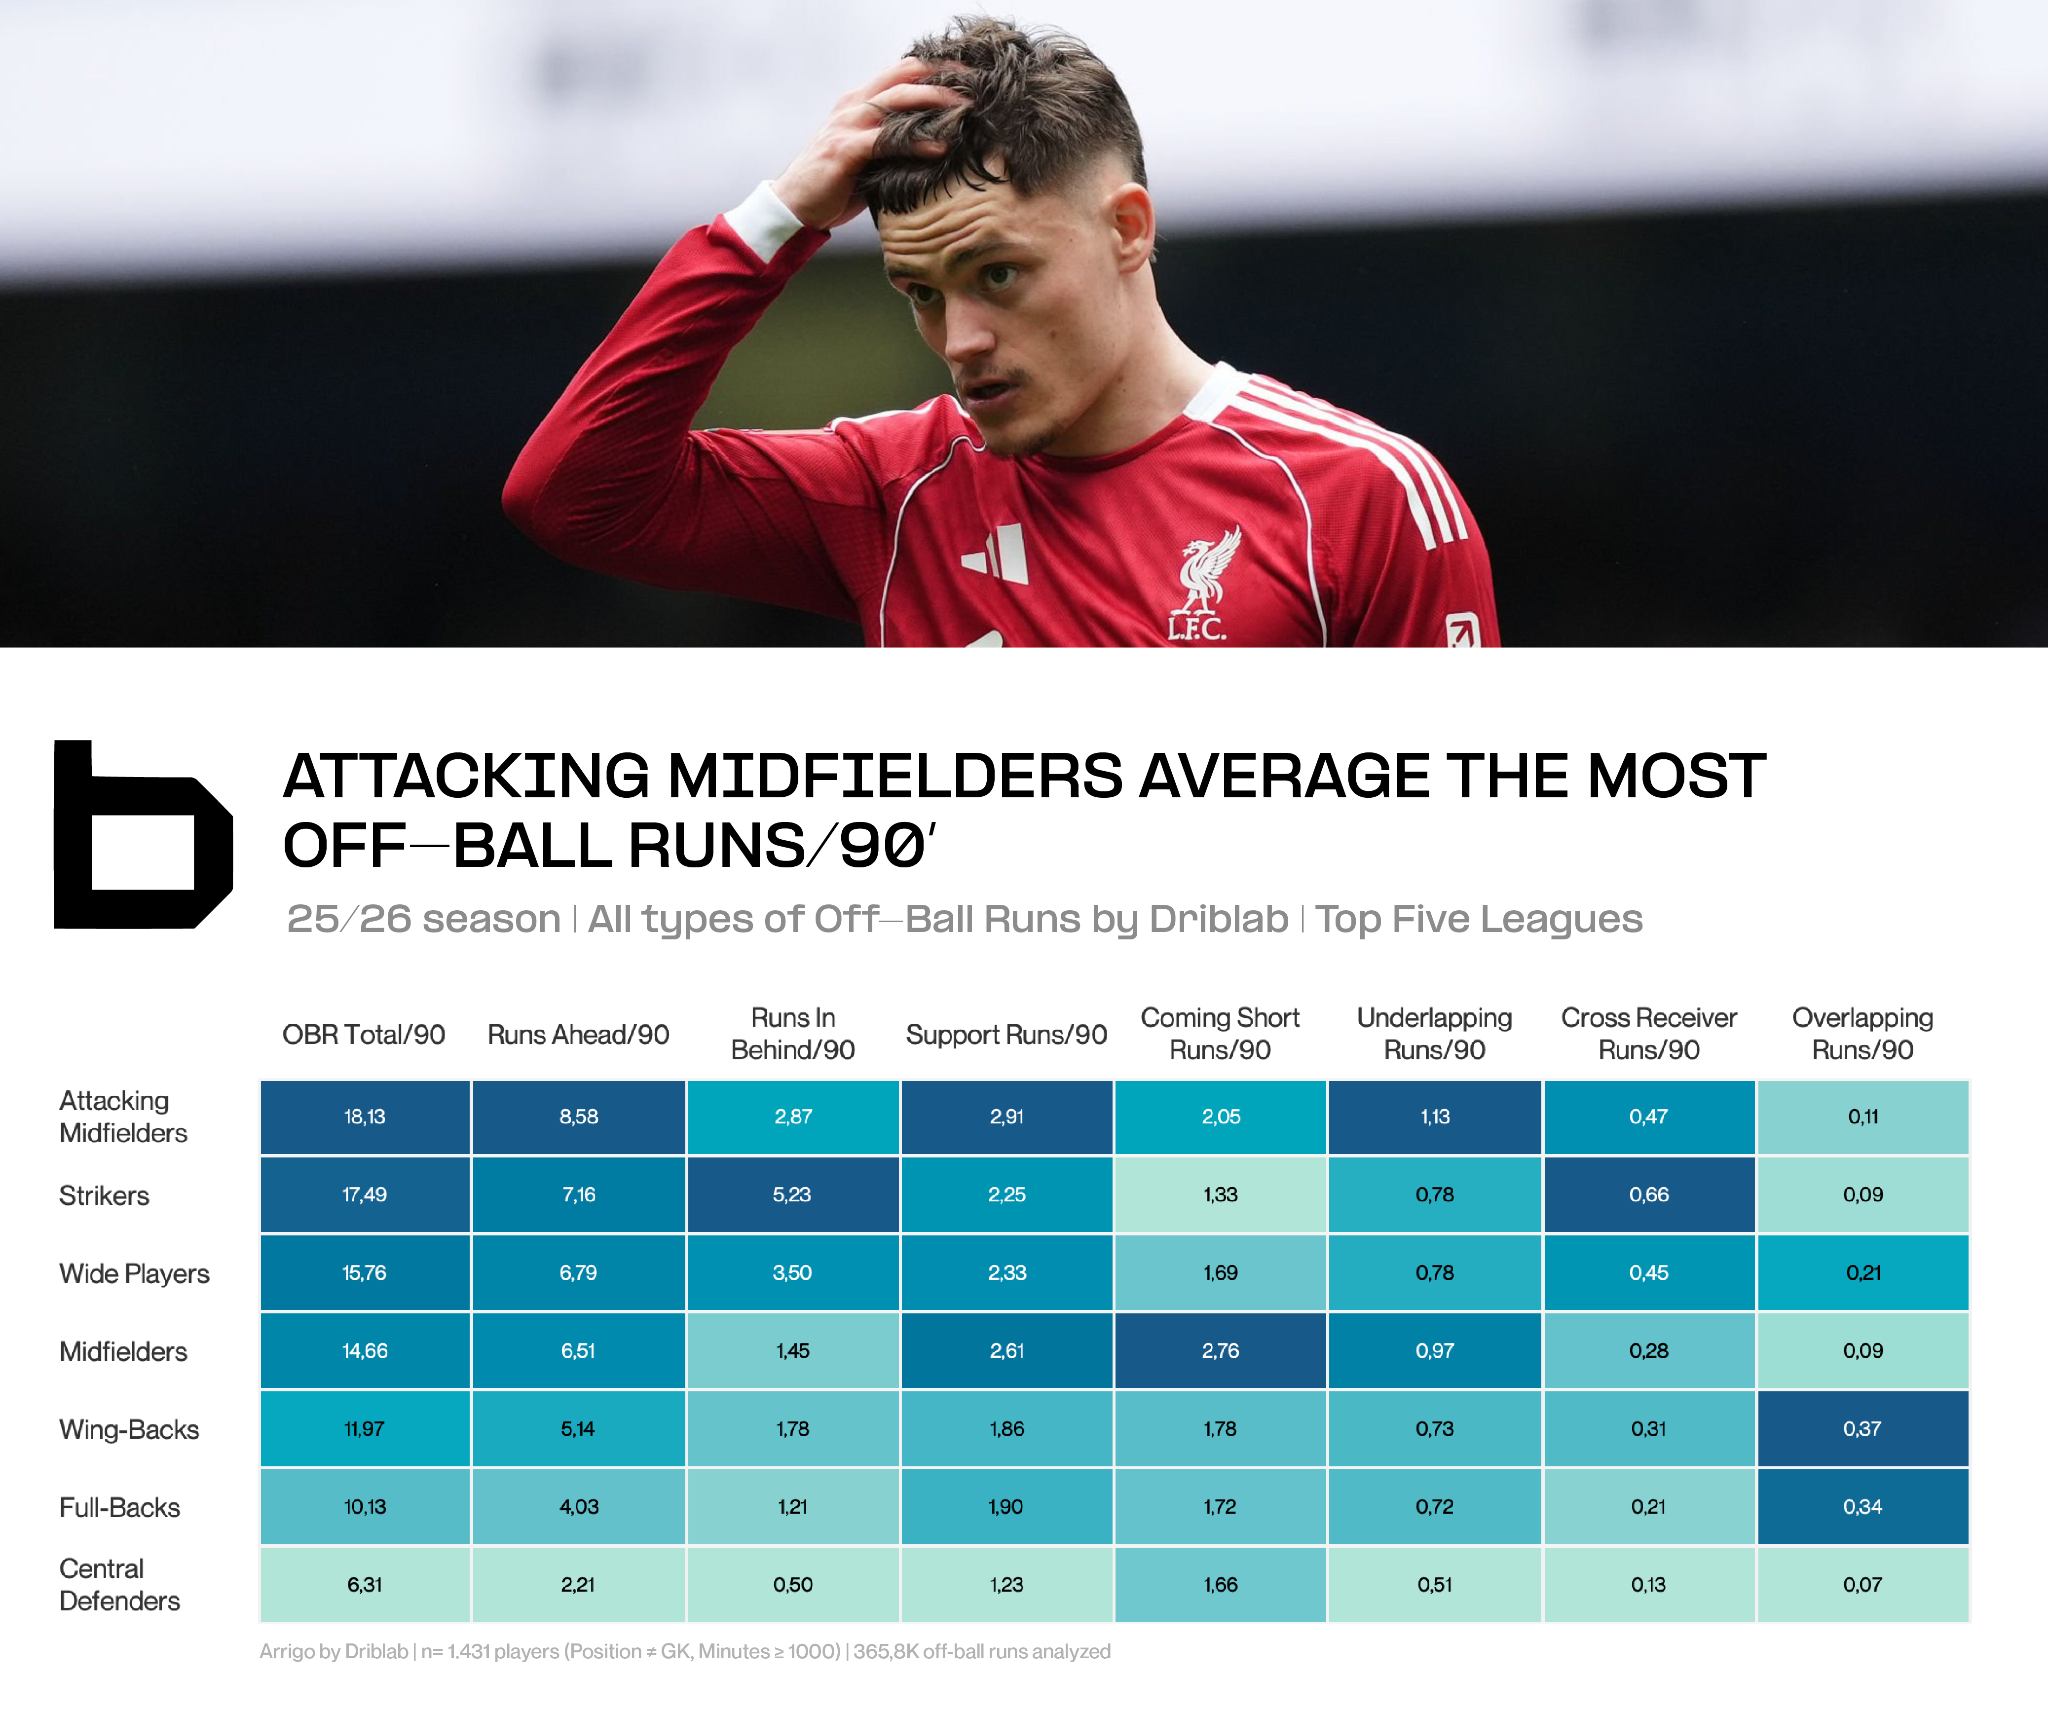
The overall distribution gives us the picture, but the interesting detail emerges when we group players by position. Each type of off-ball run naturally belongs to a specific profile: there are runs that say a lot about a striker and others we can only understand by watching them in a full-back.
The number 10 is dead, long live the number 10
Perhaps the position of the '10' has simply mutated into a role of huge off-ball work offensively: it's the position that makes the most runs per match (18.13). This is because they perform very diverse functions. In build-up they alternate between Runs Ahead of the Ball, Support Runs and Underlapping Runs. They occupy the top three in each of these categories.
A position close to the attacking midfielder is the striker, the king of runs that break in behind the last line (5.23/90) and of Cross Receiver Runs (0.66/90). These are penetrative movements (more on this later). To no one's surprise, midfielders are the ones who drop the most to receive, with the highest figure in Coming Short Runs (2.76/90).
Speaking of exclusivities: wing-backs and full-backs are the ones who make the most Overlapping Runs, a metric almost unique to their position. Centre-backs have the least off-ball running when their team has possession. They are guardians and protectors of the team's structure.
A position we've barely mentioned is the winger or wide player. In this grouping we mix wide midfielders with wingers and wide forwards, with the aim of creating a combined sample. This "wide players" grouping contains a fairly complete profile: they are the third most moving in total, second in Runs In Behind the defence and third in Overlapping Runs.

We now know which runs are typical of each position. It must be clear, however, that they are not exclusive. That is, a midfielder may, due to his team's style of play, make many Runs In Behind the last line. Or a striker may drop a lot with Support Runs. The key isn't just in how much they move, but in how they distribute that movement among the different types of off-ball runs.
That's why we've analysed the percentage weight that each type of run has on a player's total. To do this, we've grouped together those metrics that are related.
We group the seven individual types into four categories that allow us to read profiles at a glance:
- Penetrative Runs (Runs In Behind + Cross Receiver Runs) measure the willingness to attack the box.
- Link-Up Runs (Support + Coming Short Runs) measure the ability to connect with the ball carrier.
- Lapping Runs (Overlapping + Underlapping) capture actions in which a player starts behind and surpasses the teammate, of projection.
- Runs Ahead of the Ball gather the more generic runs of any attacking player and help us measure total volume.
This percentage-based approach is what allows us to build functional archetypes: two strikers with the same volume can actually be very different players depending on how they distribute their runs. And that difference is exactly what a coaching staff needs to know when looking to fit a specific profile into their model of play.
To illustrate this idea, we've taken three random profiles. Obviously, each one with data close to three of the various profiles we can create. All three accumulate enough minutes for the sample to be reliable, all three average over 16 off-ball runs per match, and yet their profiles are completely different.
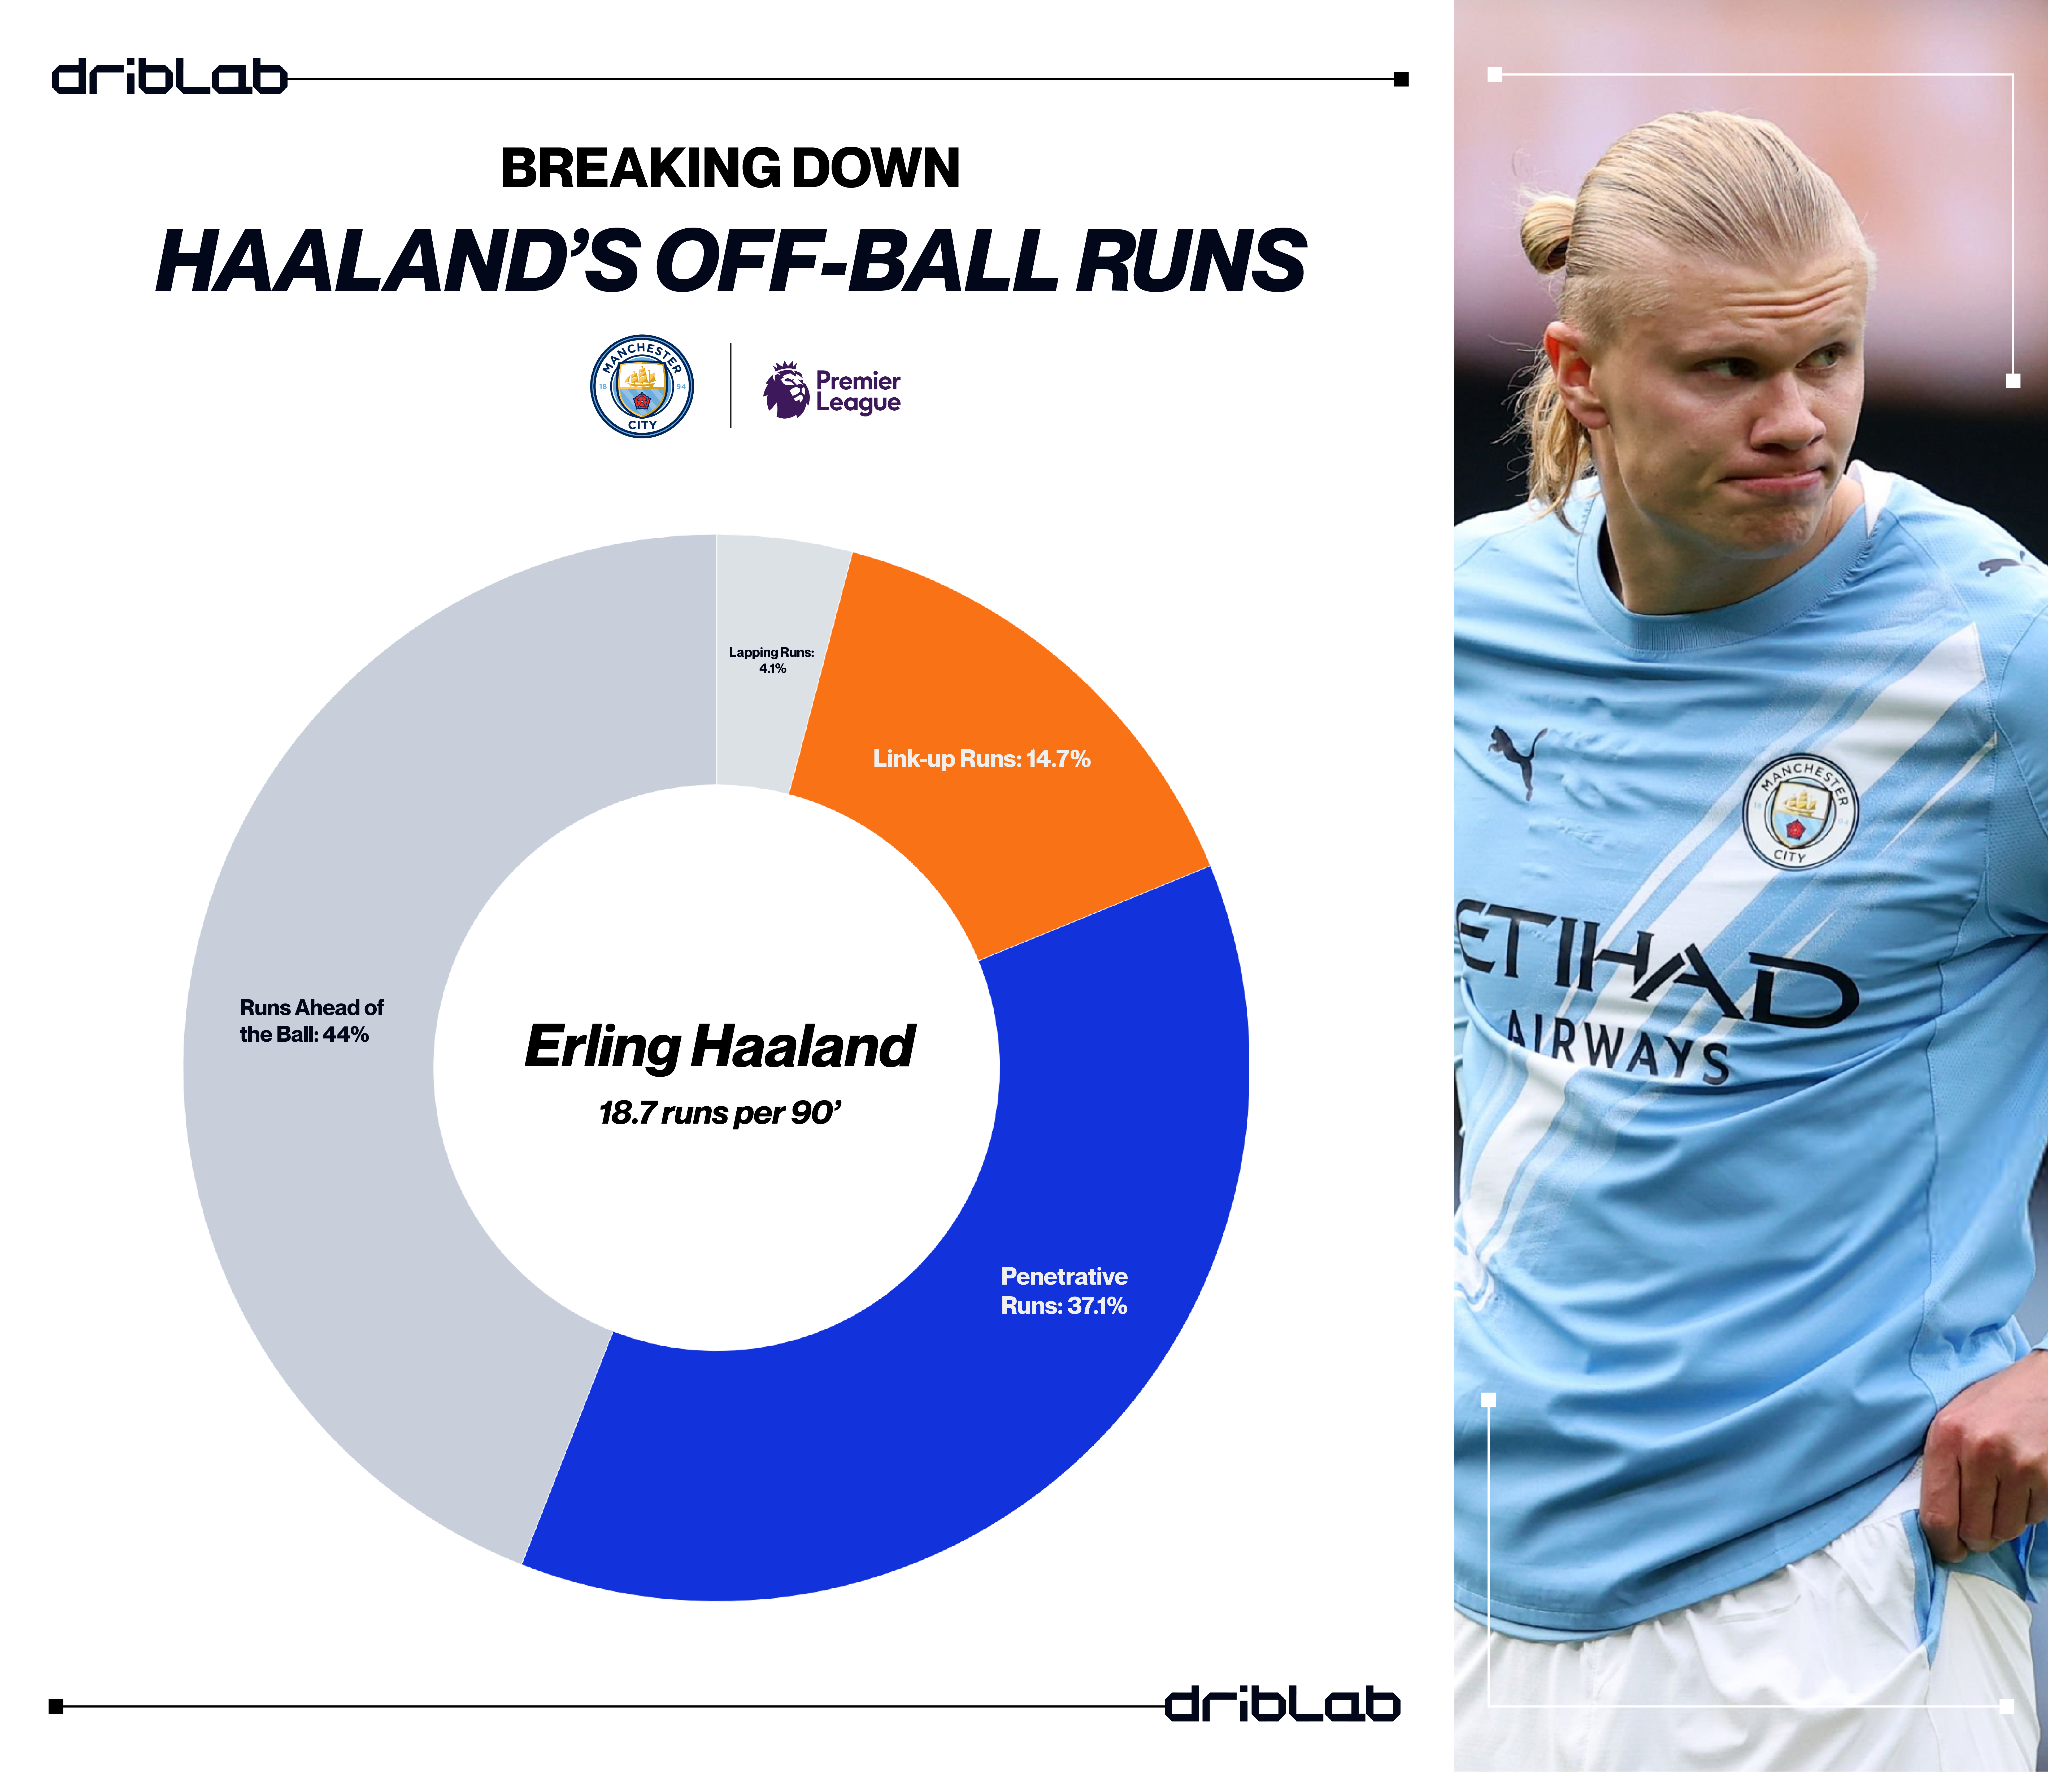
Haaland's ferocity
The Norwegian is the clearest example of the aggressive striker. The SCOUTED guys treat this striker profile as the Power Forward. A striker who is fast, who is powerful and who directs his off-ball efforts towards penetrative runs, those that seek the opposition goal decisively.
His Penetrative Runs account for 37.1% of the total, one of the highest figures among strikers in the top five leagues.
Add to that his Runs Ahead of the Ball (44.1%) and we find that nearly 8 out of every 10 Haaland runs are runs in which the player advances vertically. By contrast, his Link-Up Runs barely represent 14.7%: Haaland doesn't drop to receive and doesn't look to make contact with the ball.
He waits for his moment to be served an opportunity. This is something the Norwegian has been criticised for, but the reality is that, except in specific moments, his team has not needed him to drop to help. His goals prove him right and the data portrays it with absolute clarity.
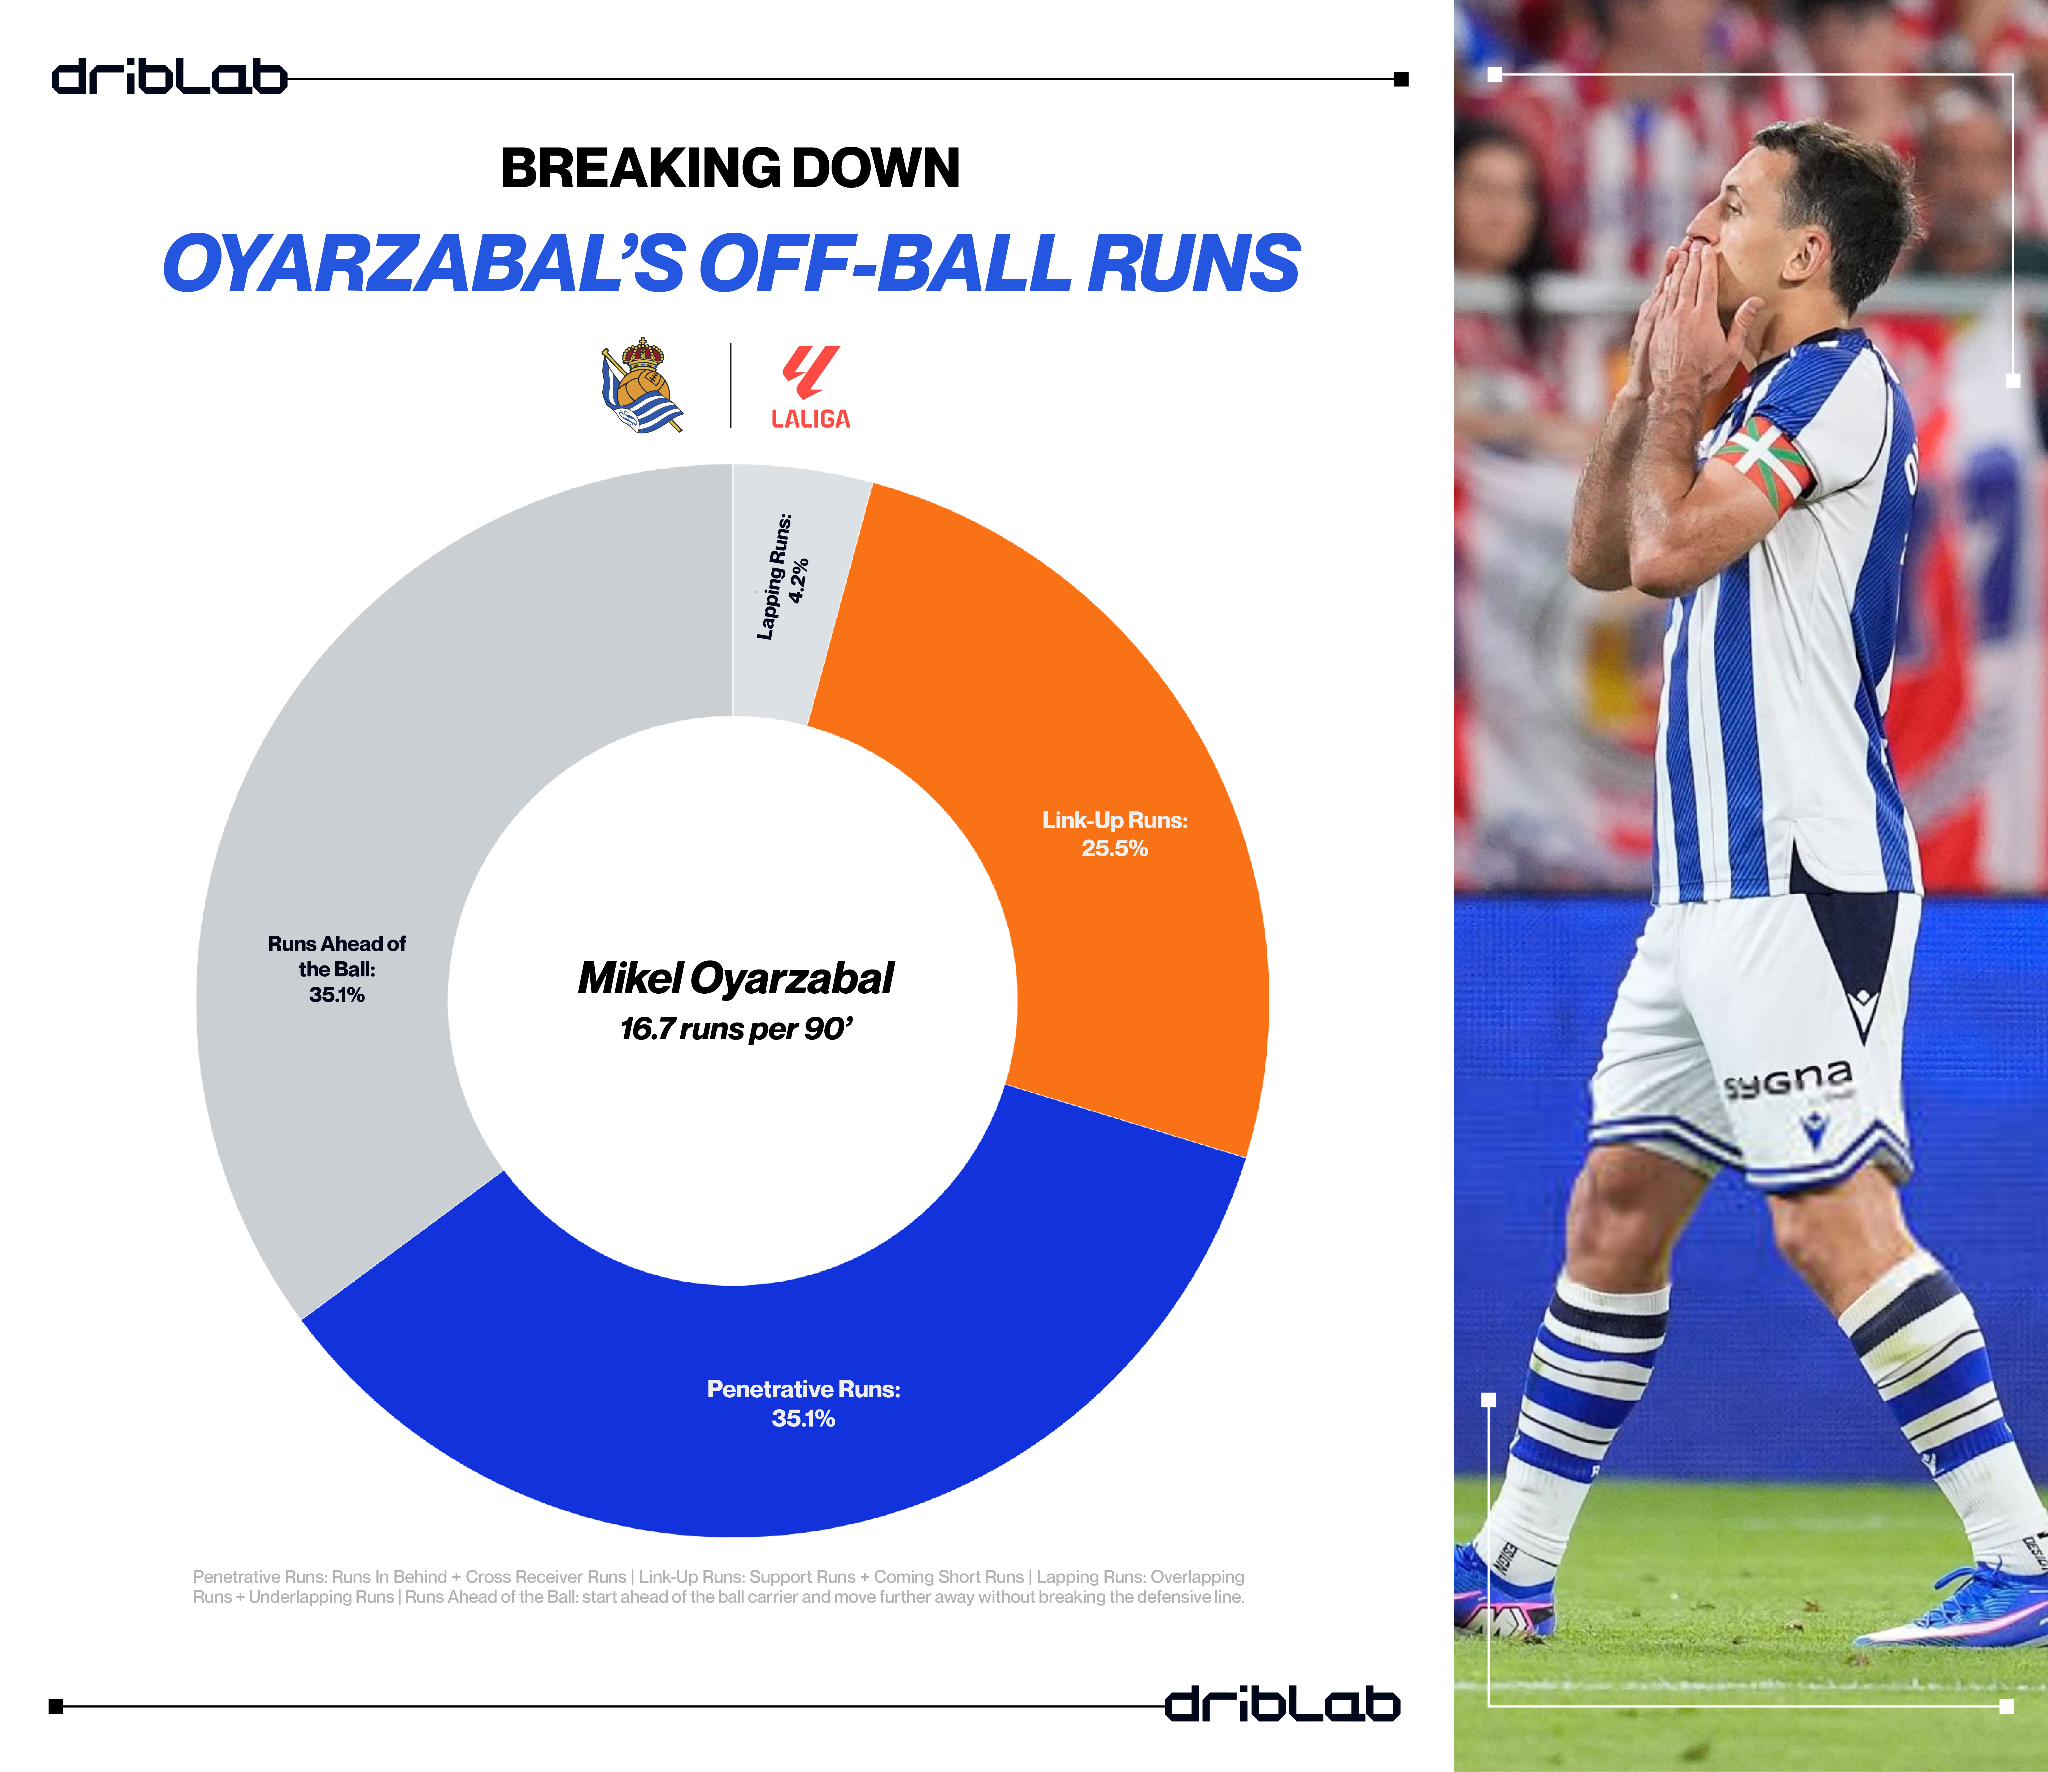
Mikel Oyarzabal is the complete profile
The Real Sociedad captain and, predictably, the striker for the Spanish national team at the World Cup offers an interesting contrast. His Penetrative Runs (35.1%) are almost on a level with Haaland's, but his Link-Up Runs reach 25.5%, nearly double the Norwegian's.
That is, Oyarzabal's movements are either upwards or downwards. There's a lower percentage of Runs Ahead of the Ball because he's not a player who dedicates himself to stretching the team unless it's to create imminent danger on the box.
Oyarzabal is not only a finisher: he also drops to combine, offers passing options to the carrier and participates in build-up. His profile reflects the hybrid striker, the one who can equally solve a fast attack in tight spaces near the box and build an elaborate move.
He is, perhaps, the type of striker who is unfairly labelled as a false 9 when he is actually the complete opposite: a striker who does a bit of everything.
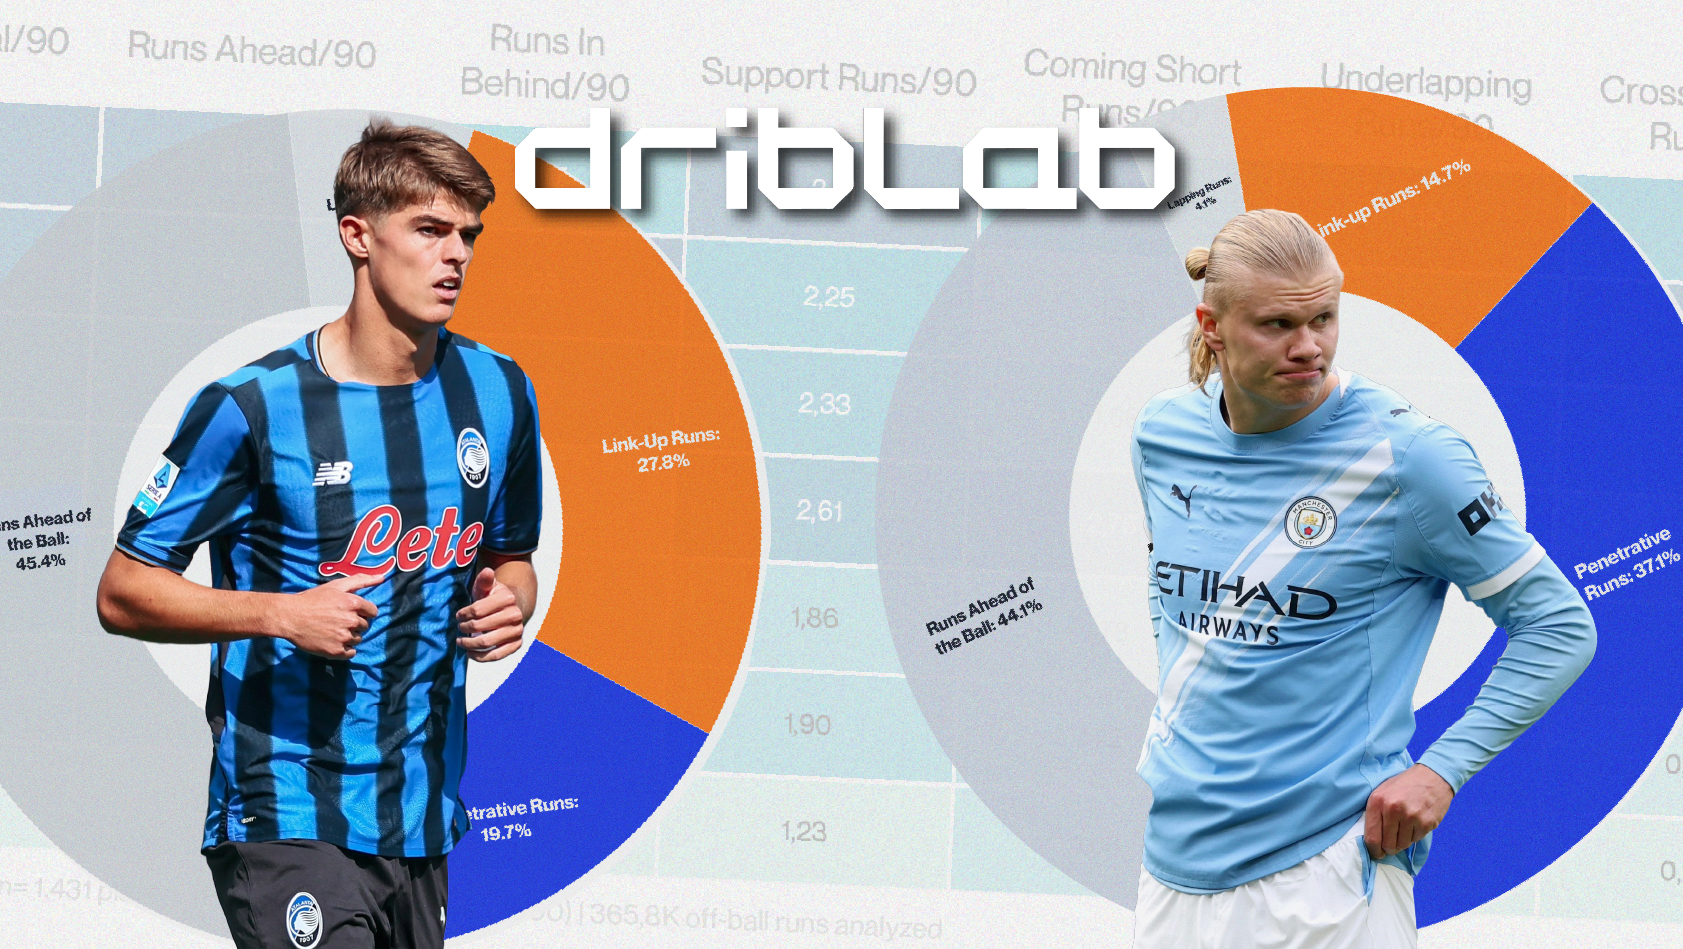
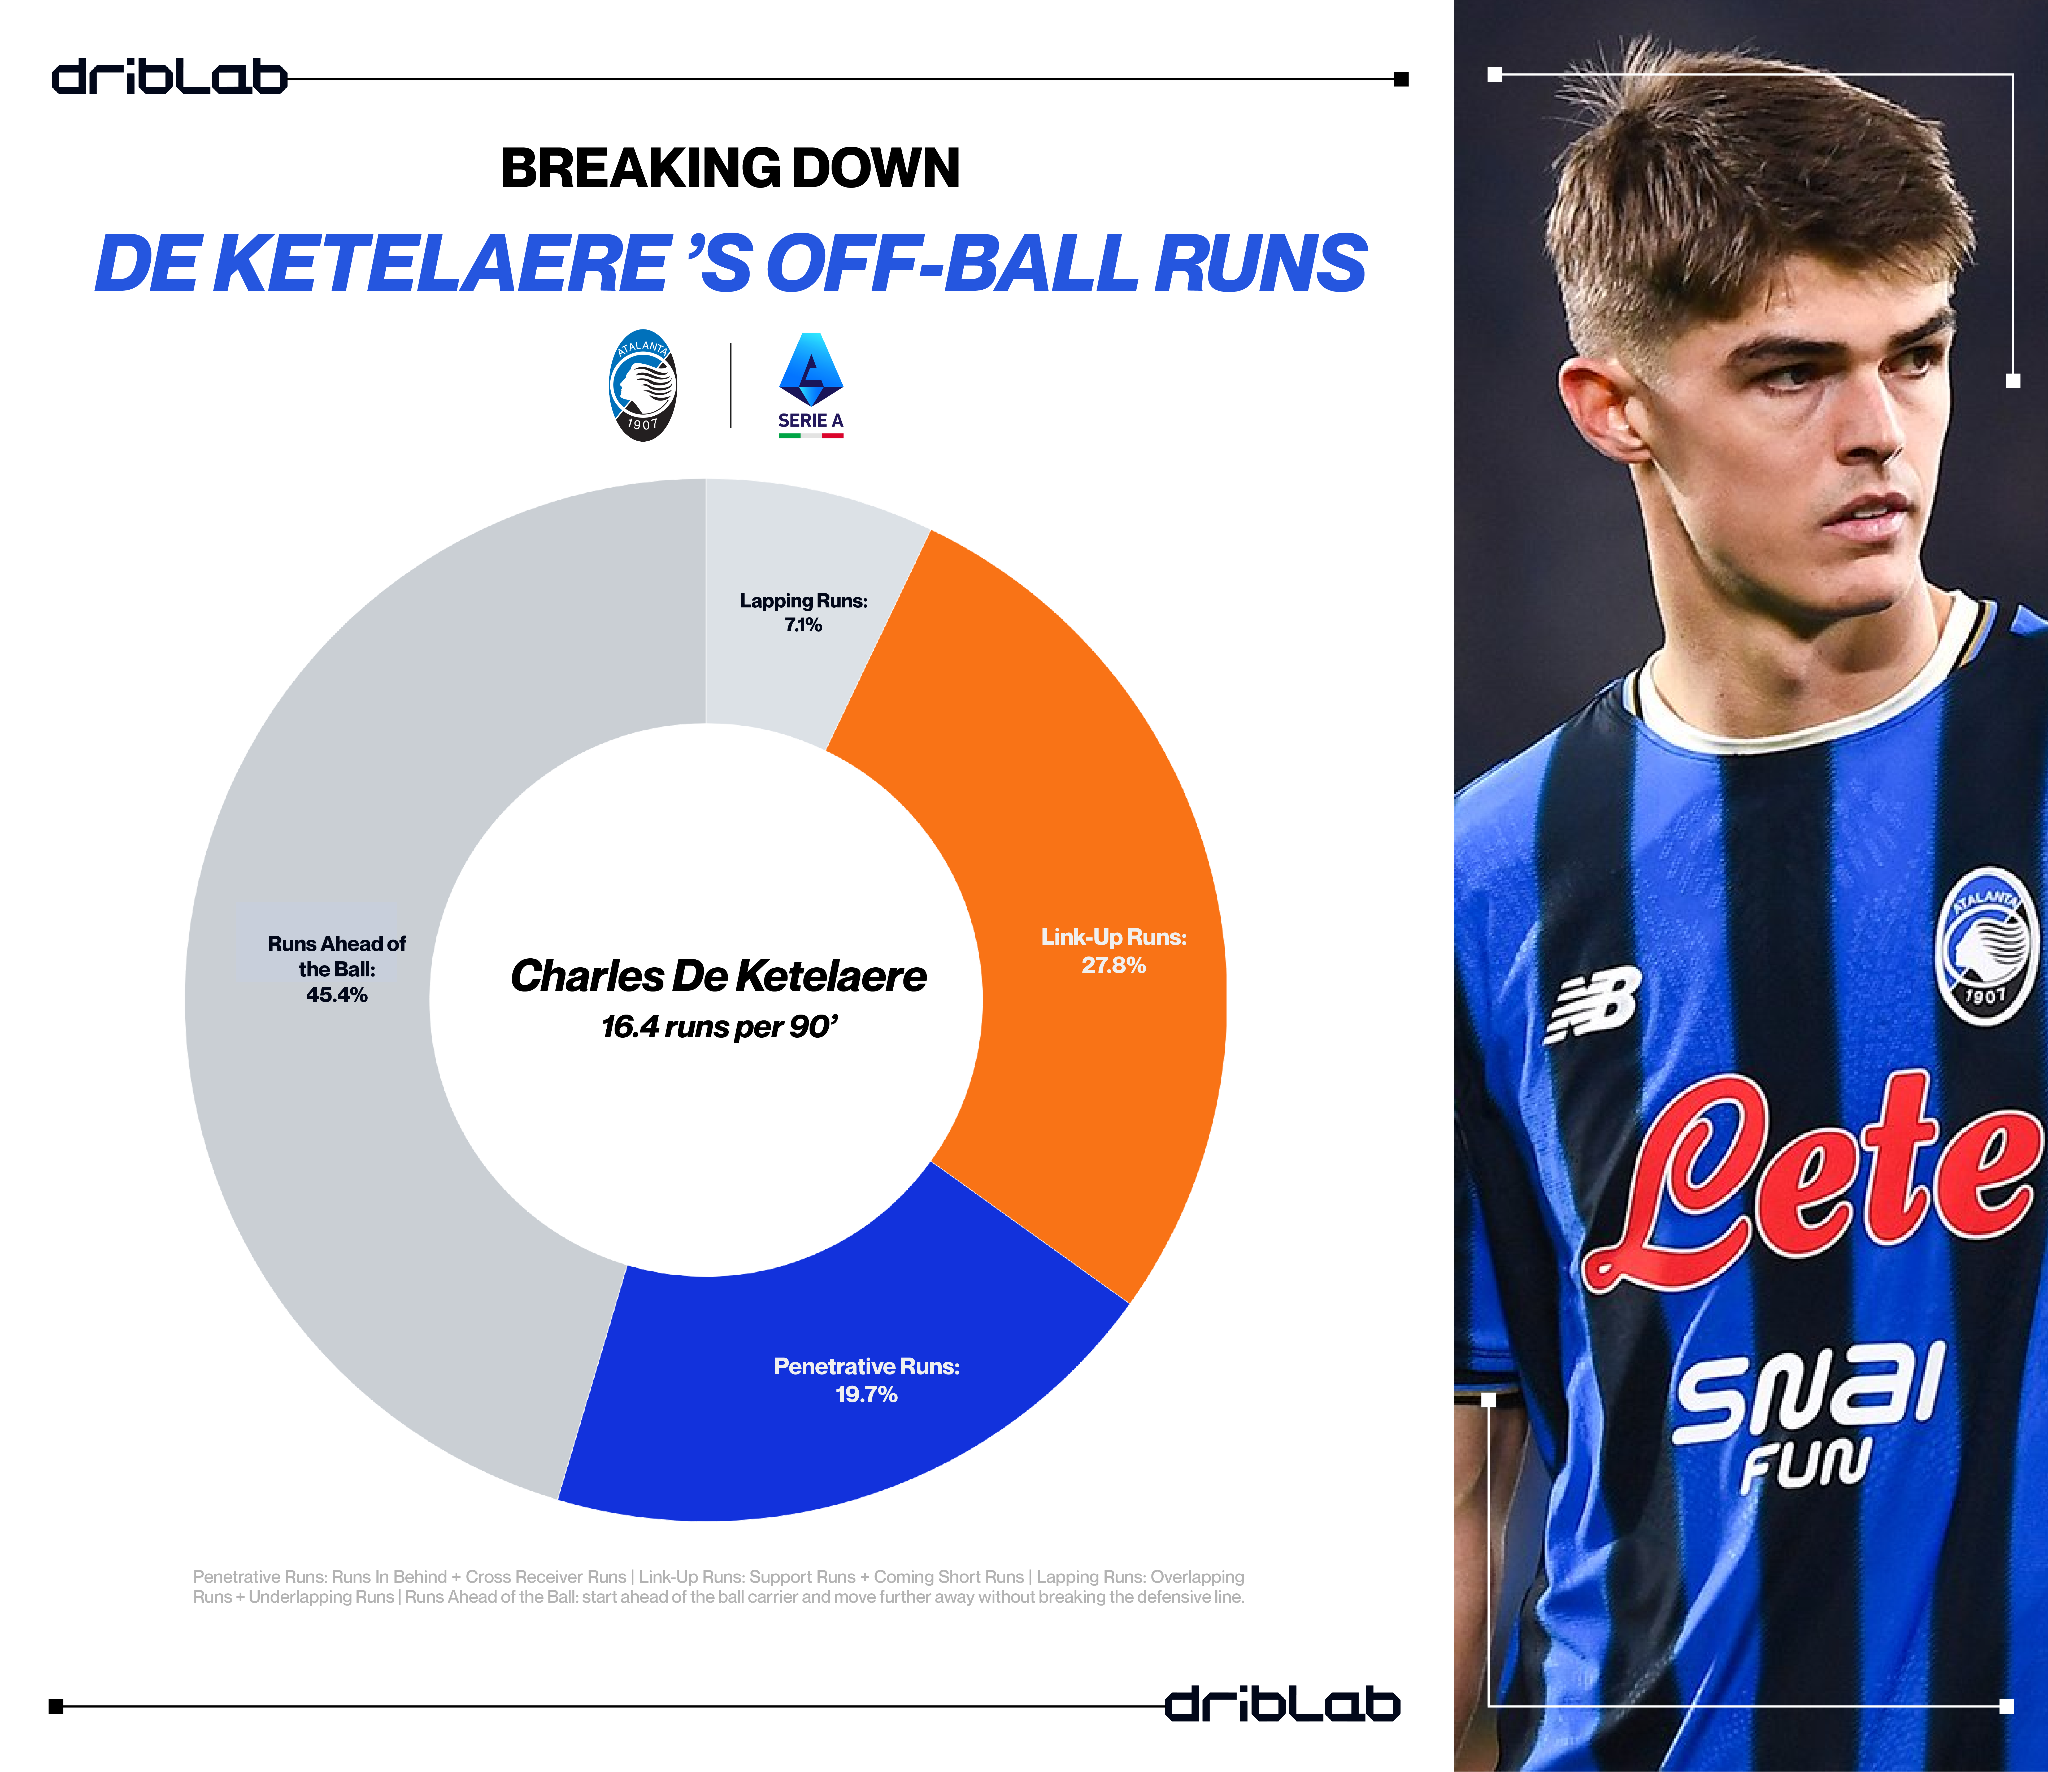
The associative profile with De Ketelaere
It's clear that this is the profile we would least relate to the 9 position, but the Belgian still is one in functional terms. The difference with Haaland is that their roles are completely opposite. His Penetrative Runs drop to 19.7% –practically half of Haaland's– while his Link-Up Runs soar to 27.8%, the highest of the trio.
His Runs Ahead of the Ball are associative movements and not so much about stretching the opposition or drifting wide to drag defenders. De Ketelaere associates more than he penetrates, something unusual in a centre-forward and one that fits perfectly with Atalanta's model, where one 9 plays a more connecting role between the lines and the other is a pure finisher, like Krstovic.
He is the textbook example of an associative striker: the same nominal positions as Haaland, but a completely opposite functional role.
A layer of information that until very recently was invisible to traditional analysis. Identifying these profiles with objective data completely changes processes such as scouting, opposition analysis or the planning of a model of play: it's no longer about signing "a striker", but about signing the striker whose profile fits what the team needs.