Driblab vs. The Rest: Outscoring Everybody
In an increasingly data-driven football environment, where analysis plays a central role in decision-making, the quality of that information has become an absolutely decisive and differentiating factor for companies like ours. At Driblab, we understand innovation as an unquestionable, continuous, and demanding process, in which data accuracy and reliability are the foundation for rigorously evaluating player performance and potential. This document therefore aims to provide context and assess the quality of our physical data, confirming that it stands as the most accurate in the market.
Driblab’s physical performance data is evaluated against optical tracking data obtained from in-stadium multi-camera systems. We use optical tracking as our primary reference because it is the most reliable method for monitoring all players simultaneously with the highest possible level of precision. By capturing every movement on the pitch in real time, optical tracking ensures consistent, objective, and comprehensive physical data, making it the gold standard for accurately assessing collective and individual performance. To provide broader context, Driblab’s metrics are also benchmarked against those of its closest competitor. The competitor’s physical data is likewise derived from broadcast footage.
Optical tracking systems rely on state-of-the-art multi-camera setups installed inside the stadium, capturing player movements with high spatial and temporal precision. Due to their accuracy and direct measurement of on-pitch actions, these systems are widely regarded as the gold standard for physical performance data in elite football. As such, camera tracking serves as the primary reference point for evaluating the reliability of broadcast-based solutions, including Driblab.
All analyses are conducted on an identical dataset consisting of all matches in one full season of one of the top-5 leagues, ensuring full consistency across Driblab, the closest competitor, and Optical Tracking.

Overall Distances
When comparing the total distance covered by players per match, Driblab shows an exceptionally strong correlation with Optical Tracking, exceeding 98%. This result confirms that Driblab’s broadcast-based methodology is able to replicate overall player workload with a very high level of accuracy.
Beyond correlation, it is also essential to assess how closely the absolute values and distributions of total distance align across providers.
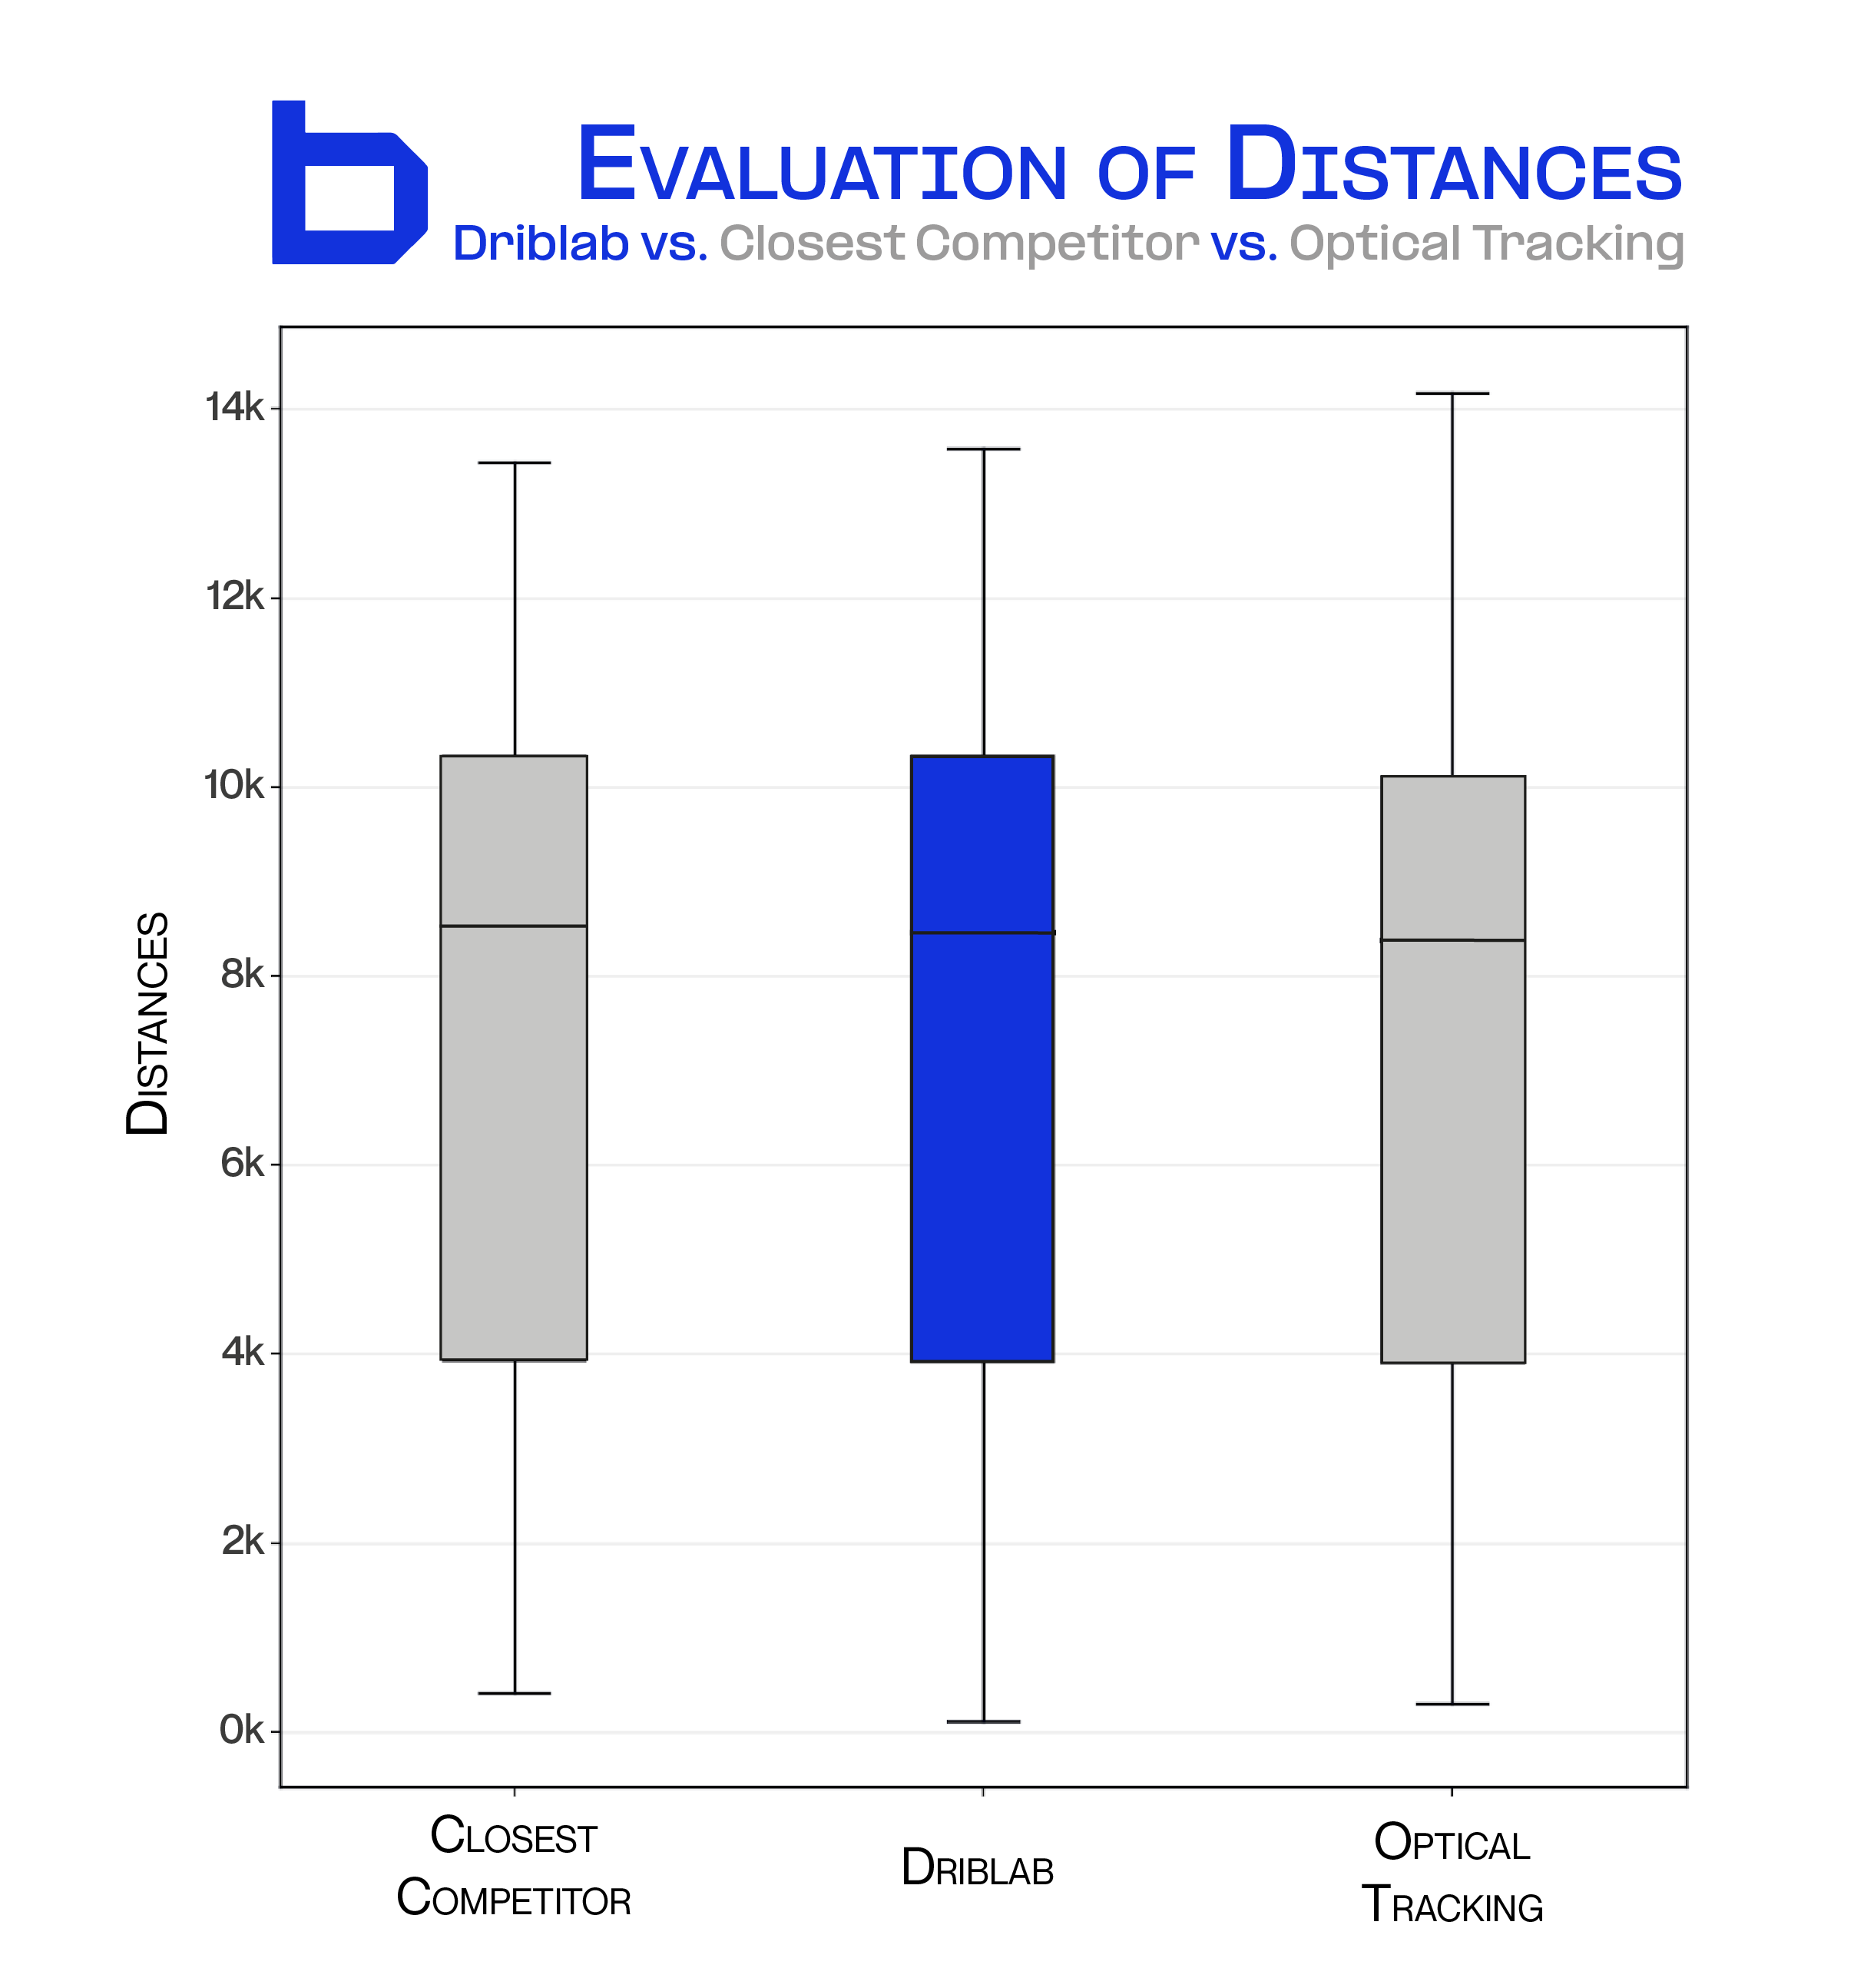
The distribution analysis shows that Driblab’s total distance values not only track Optical Tracking closely in correlation terms, but also follow a highly similar range and magnitude.
When compared with the closest competitor, Driblab demonstrates a more consistent alignment with Optical Tracking, reinforcing the reliability of its distance metrics both statistically and practically.
Broken Down By Categories
In addition to total distance, Driblab provides a granular breakdown of player movement by intensity, measuring both High-Speed Runs (HSR) and Sprints based on defined speed thresholds.
As with total distance, these metrics are derived from broadcast footage and designed to capture the most physically demanding phases of match play.
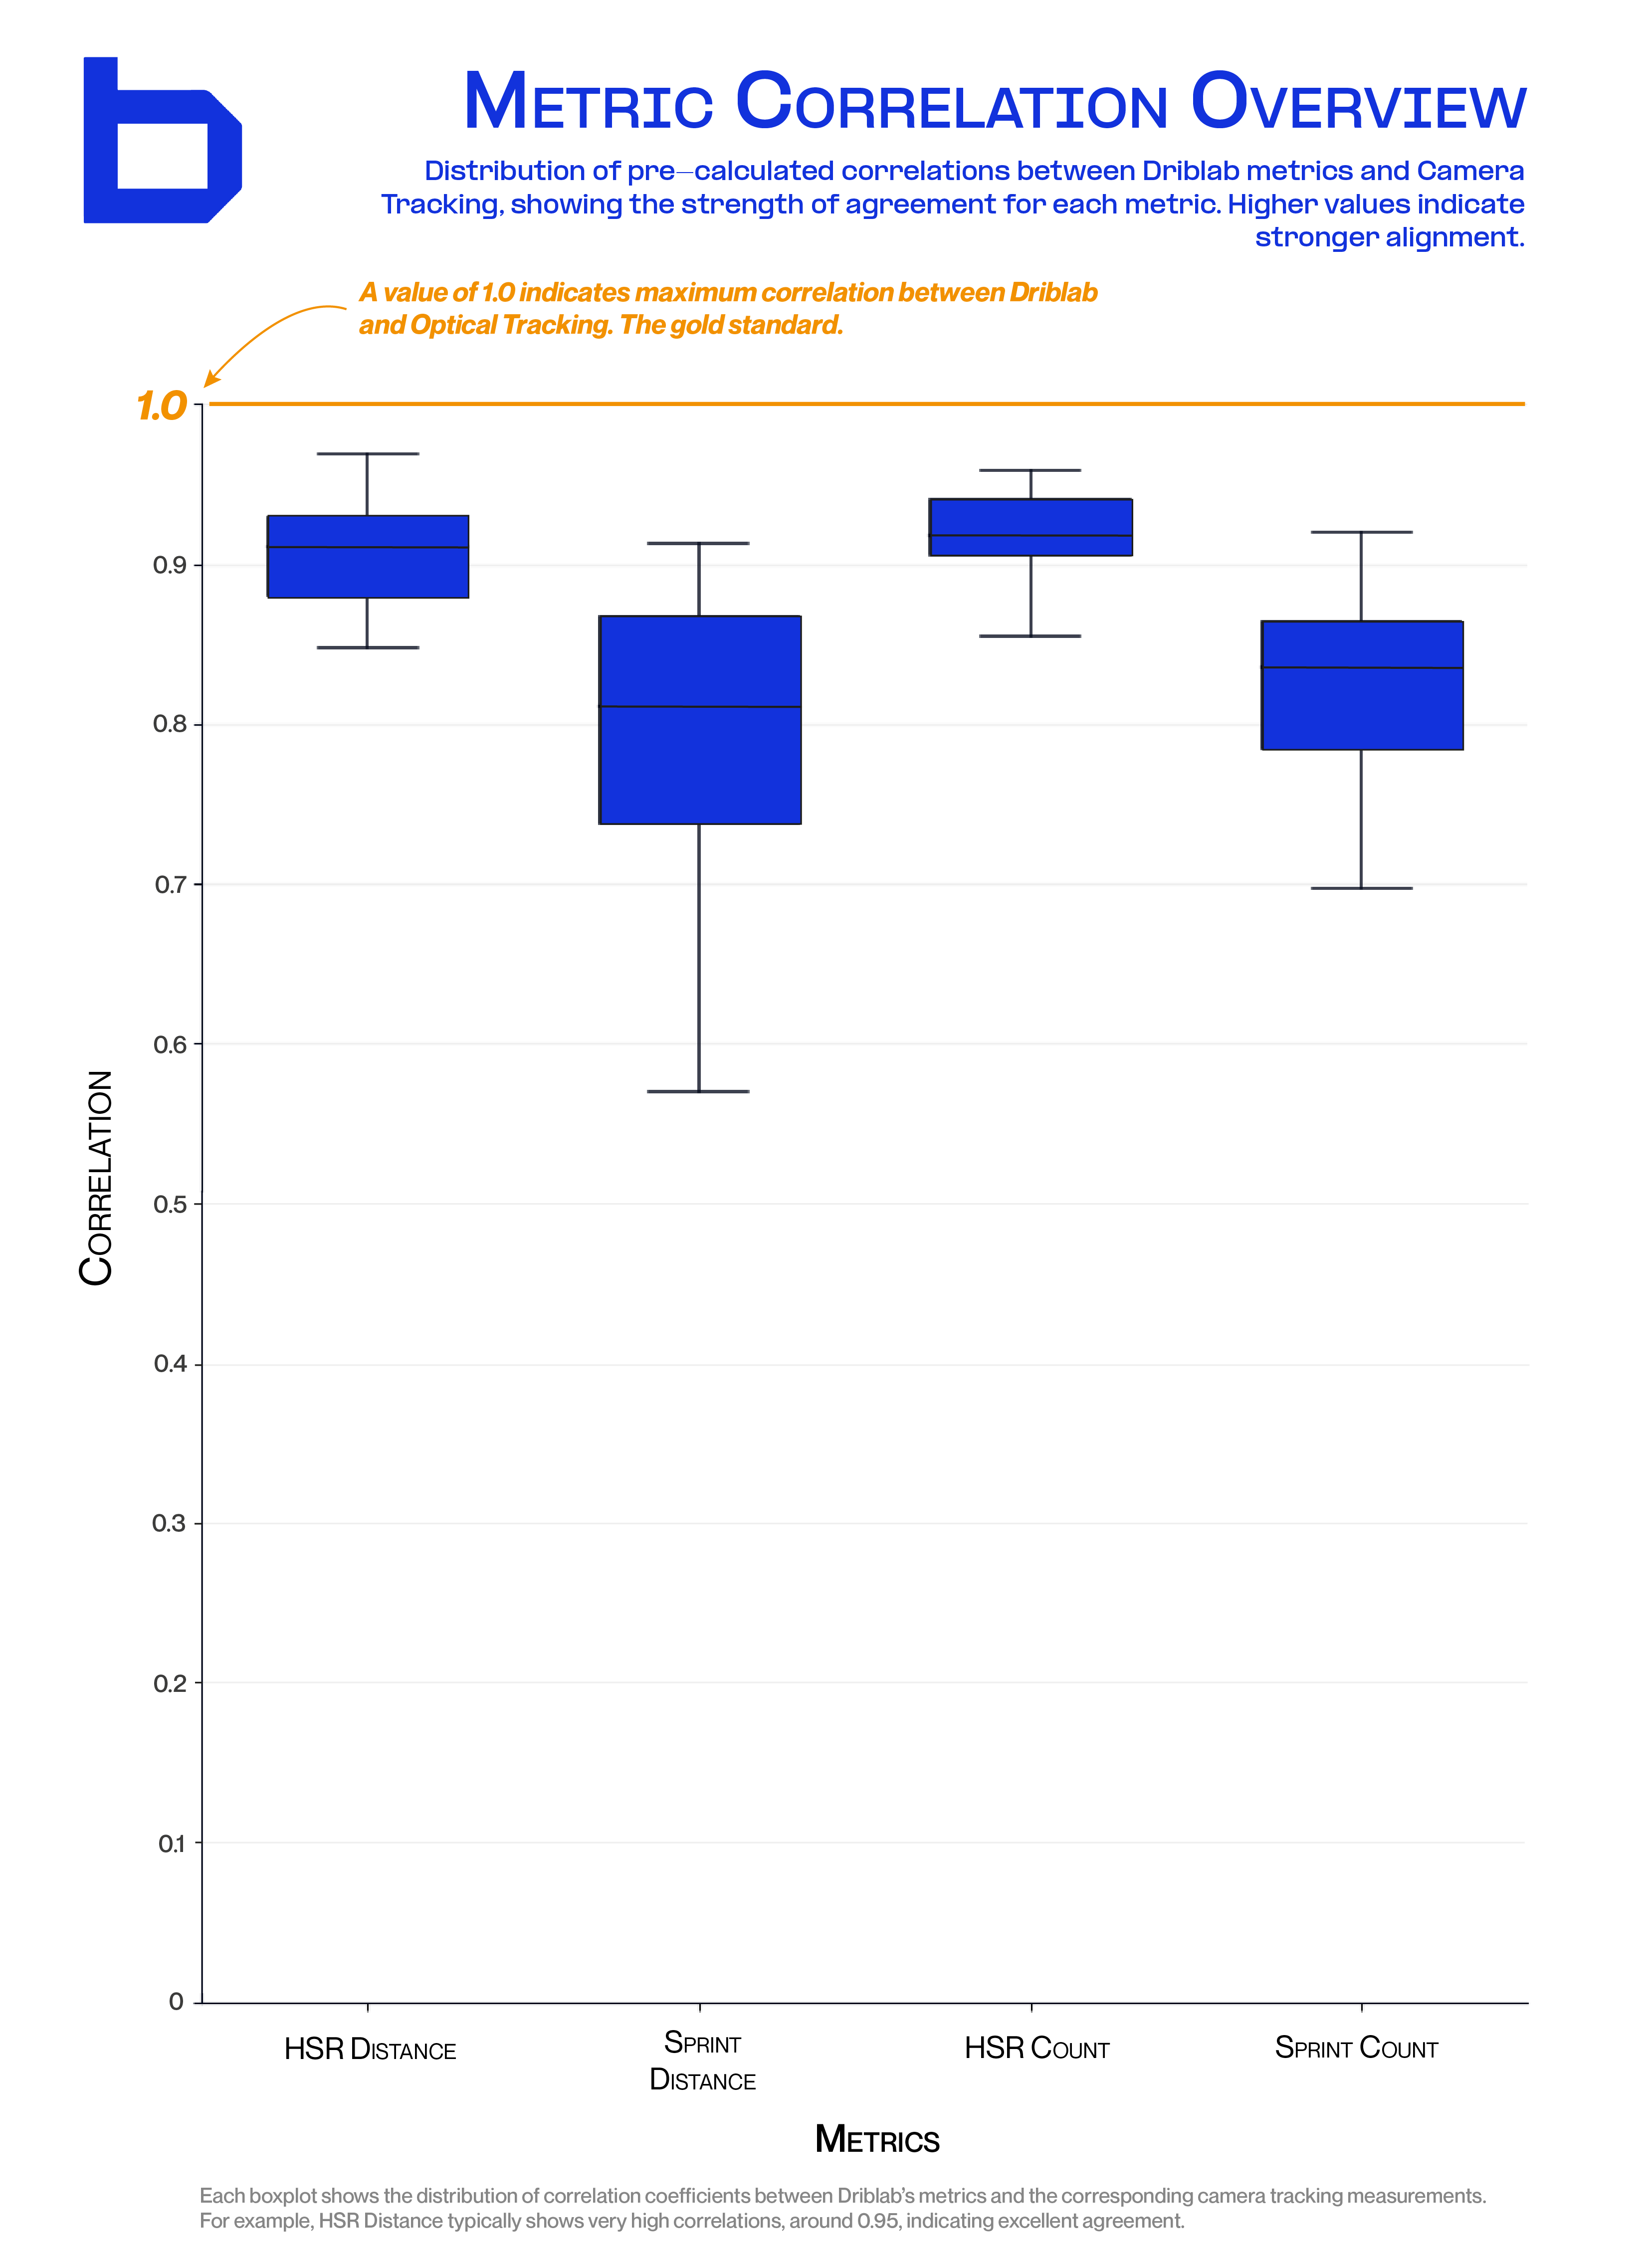
Across both raw action counts and distance covered within each intensity band, Driblab’s metrics show very high correlations with Optical Tracking. This demonstrates Driblab’s ability to consistently identify and quantify high-intensity actions in line with the gold-standard reference.
Focusing specifically on HSR Count and HSR Distance, a closer look at the distributions provides additional insight into metric quality.
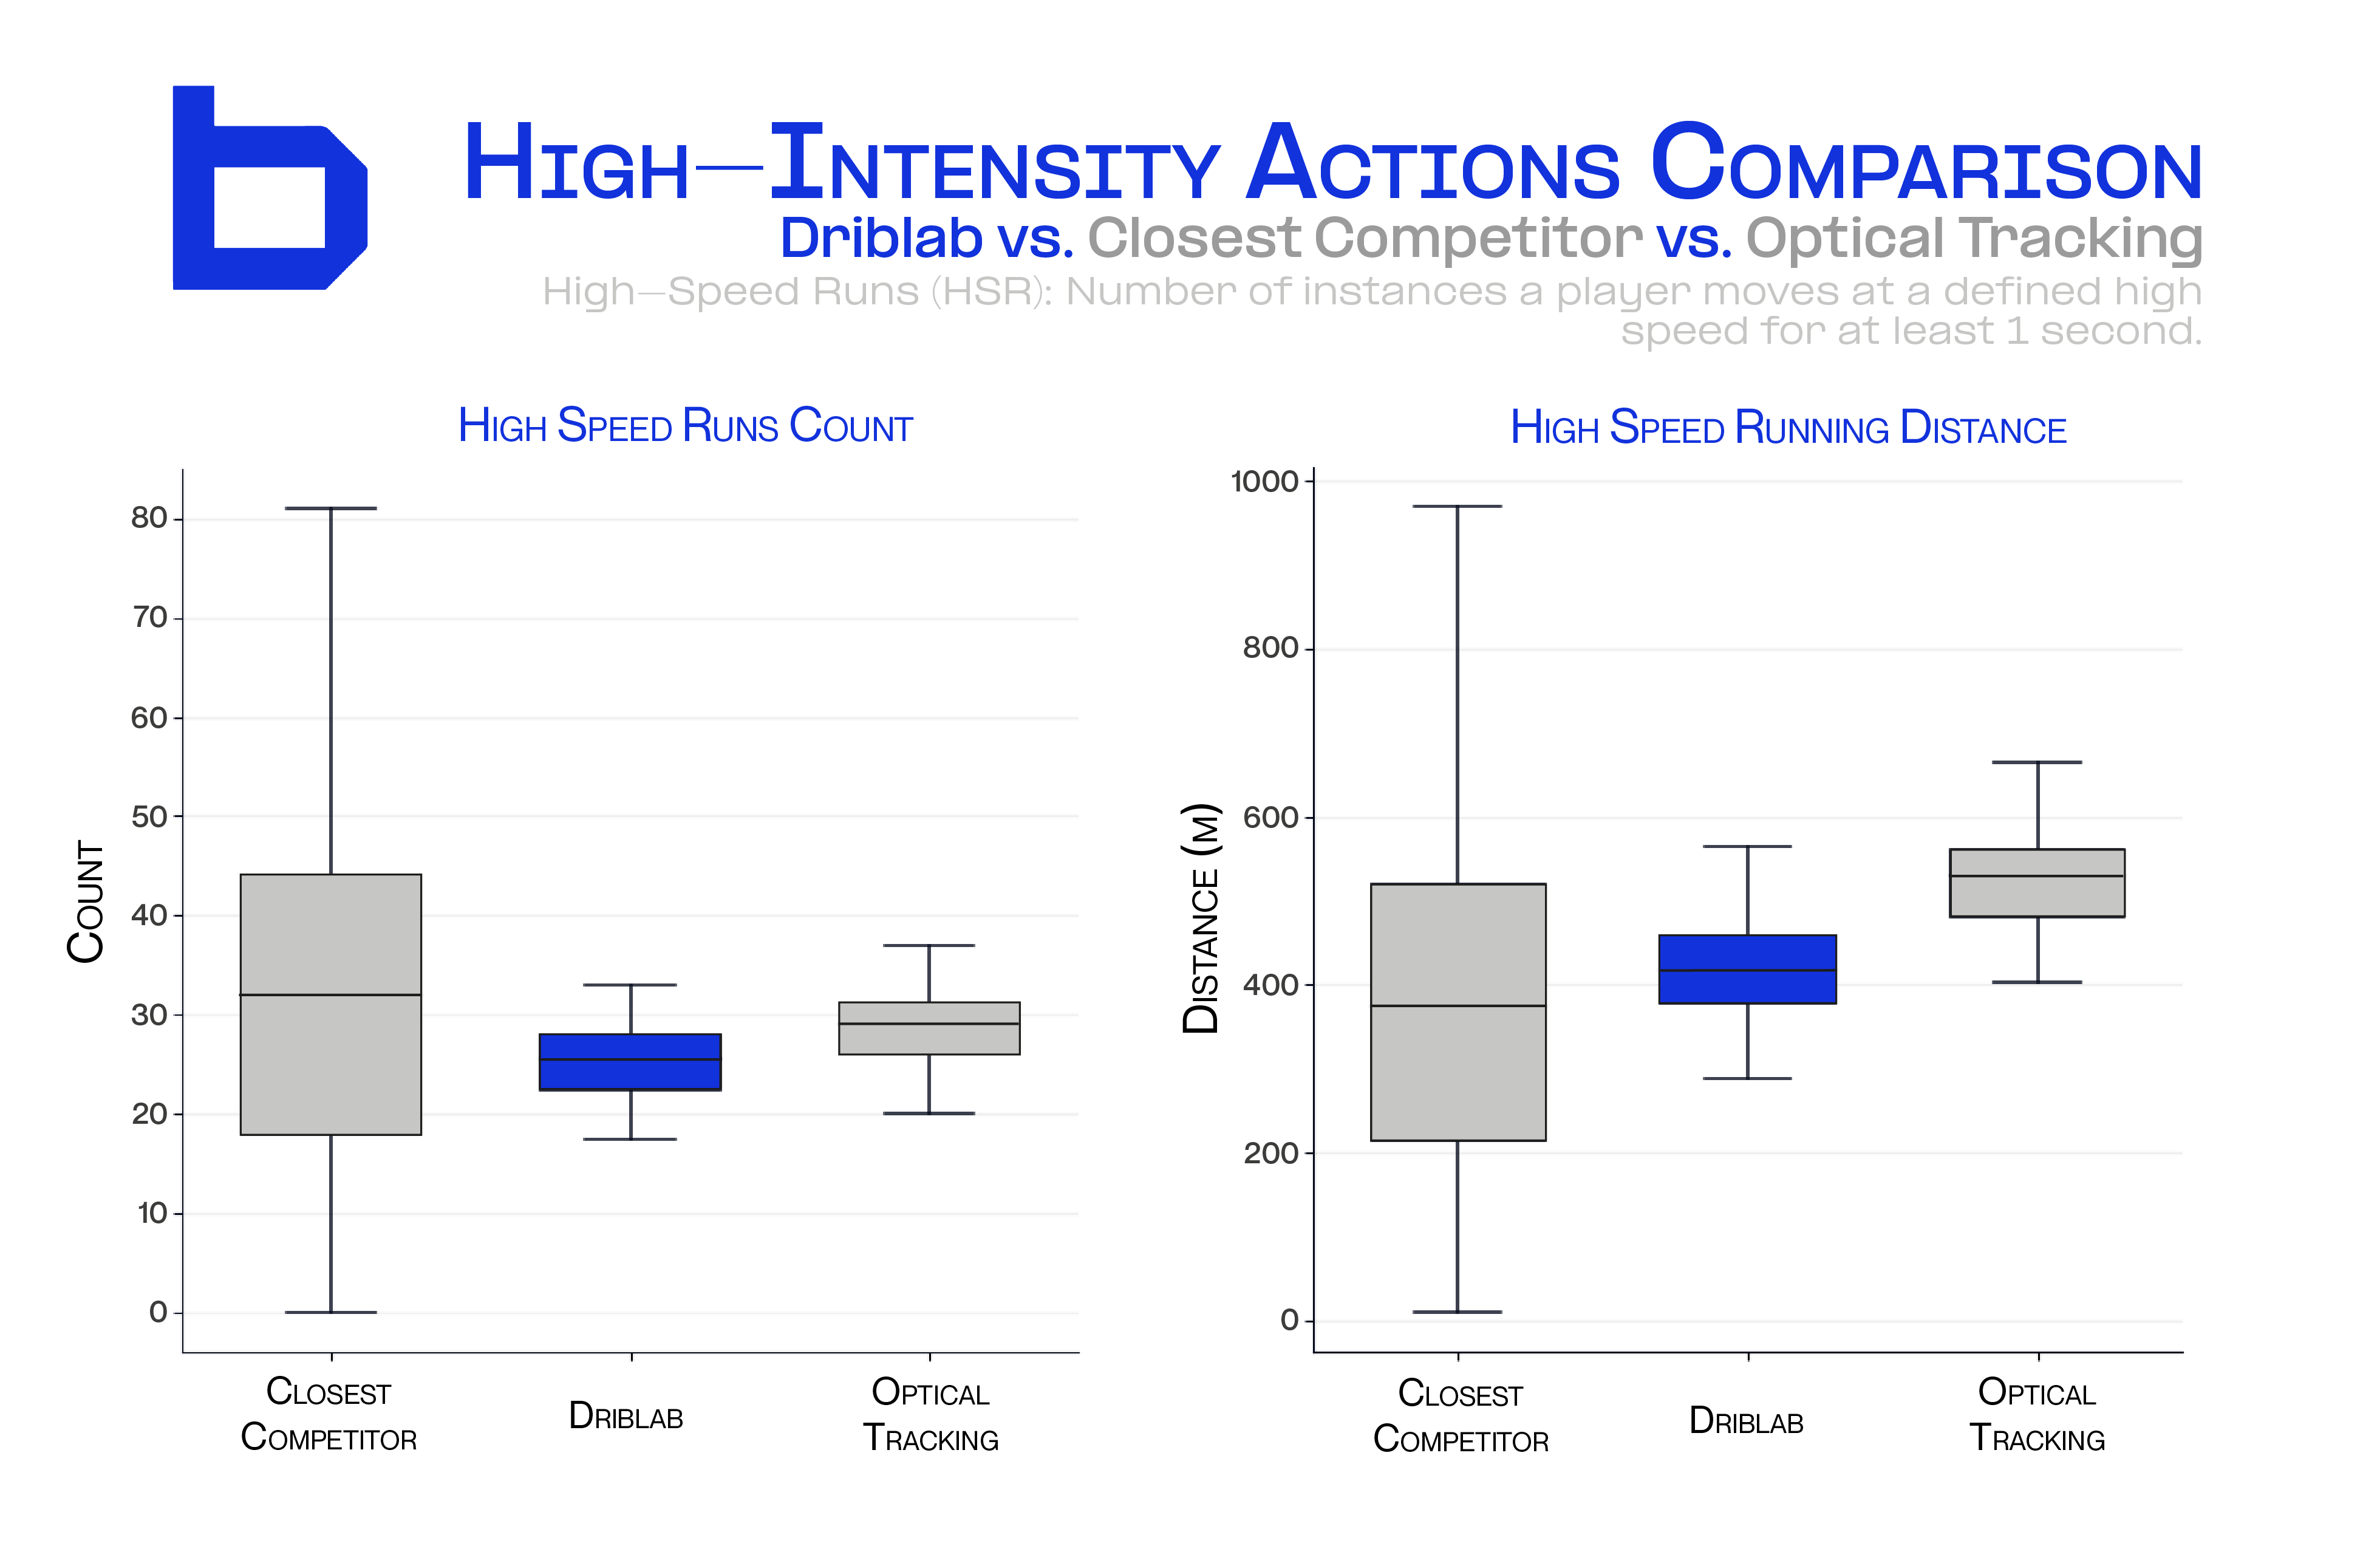
For both metrics, Driblab’s distributions closely mirror those observed in Optical Tracking, showing strong alignment in terms of range, central tendency, and overall shape.
Compared to the closest competitor, Driblab reproduces the underlying physical patterns of high-speed activity more faithfully, particularly for HSR actions, indicating a higher level of reliability and consistency.
The criteria and thresholds used by Driblab for Sprints and High-Speed Runs are stricter. Unlike our closest competitor and the reference of Optical Tracking, a sprint, according to Driblab, occurs/is registered when a player moves at a speed equal to or greater than 7 m/s (25.2 km/h) for at least 1 second. On the other hand, High-Speed Runs (HSR) occurs when a player moves at a speed equal to or greater than 5.5 m/s (19.8 km/h) but less than 7 m/s (25.2 km/h) for at least 1 second.
Driblab is deliberately more demanding with these thresholds, both in terms of speed and the minimum duration required, because we believe that sprints and HSRs are key movements that should discriminate, in both quantity and intensity, between the good players and the truly elite. In this process, we analyzed the impact and real significance within the game and its dynamics of high-intensity efforts lasting less than one second, finding that a very significant number of them lacked value for profiling players’ physical performance.
These criteria differ from other providers, as well as from optical tracking and our closest competitor, leading to significant variations. In the case of our closest competitor, their thresholds are much higher, which reduces precision by assigning the same number of sprints and high-speed running to a large number of players in each match, as illustrated in the graph above.
For both metrics, Driblab’s distributions closely mirror those observed in Optical Tracking, showing strong alignment in terms of range, central tendency, and overall shape.
Compared to the closest competitor, Driblab reproduces the underlying physical patterns of high-speed activity more faithfully, particularly for HSR actions, indicating a higher level of reliability and consistency.
Max. Speed Comparison
Maximum speed is one of the most sensitive physical metrics, as it is highly influenced by tracking methodology, sampling frequency, and trajectory reconstruction. Minor differences in how player movement is detected and smoothed can result in meaningful discrepancies in recorded peak velocities, making this metric a strong indicator of overall tracking quality.
Because of this sensitivity, maximum speed provides a robust benchmark for evaluating how closely broadcast-based tracking solutions align with optical tracking systems, which rely on in-stadium multi-camera setups and are widely considered the gold standard for physical performance measurement.
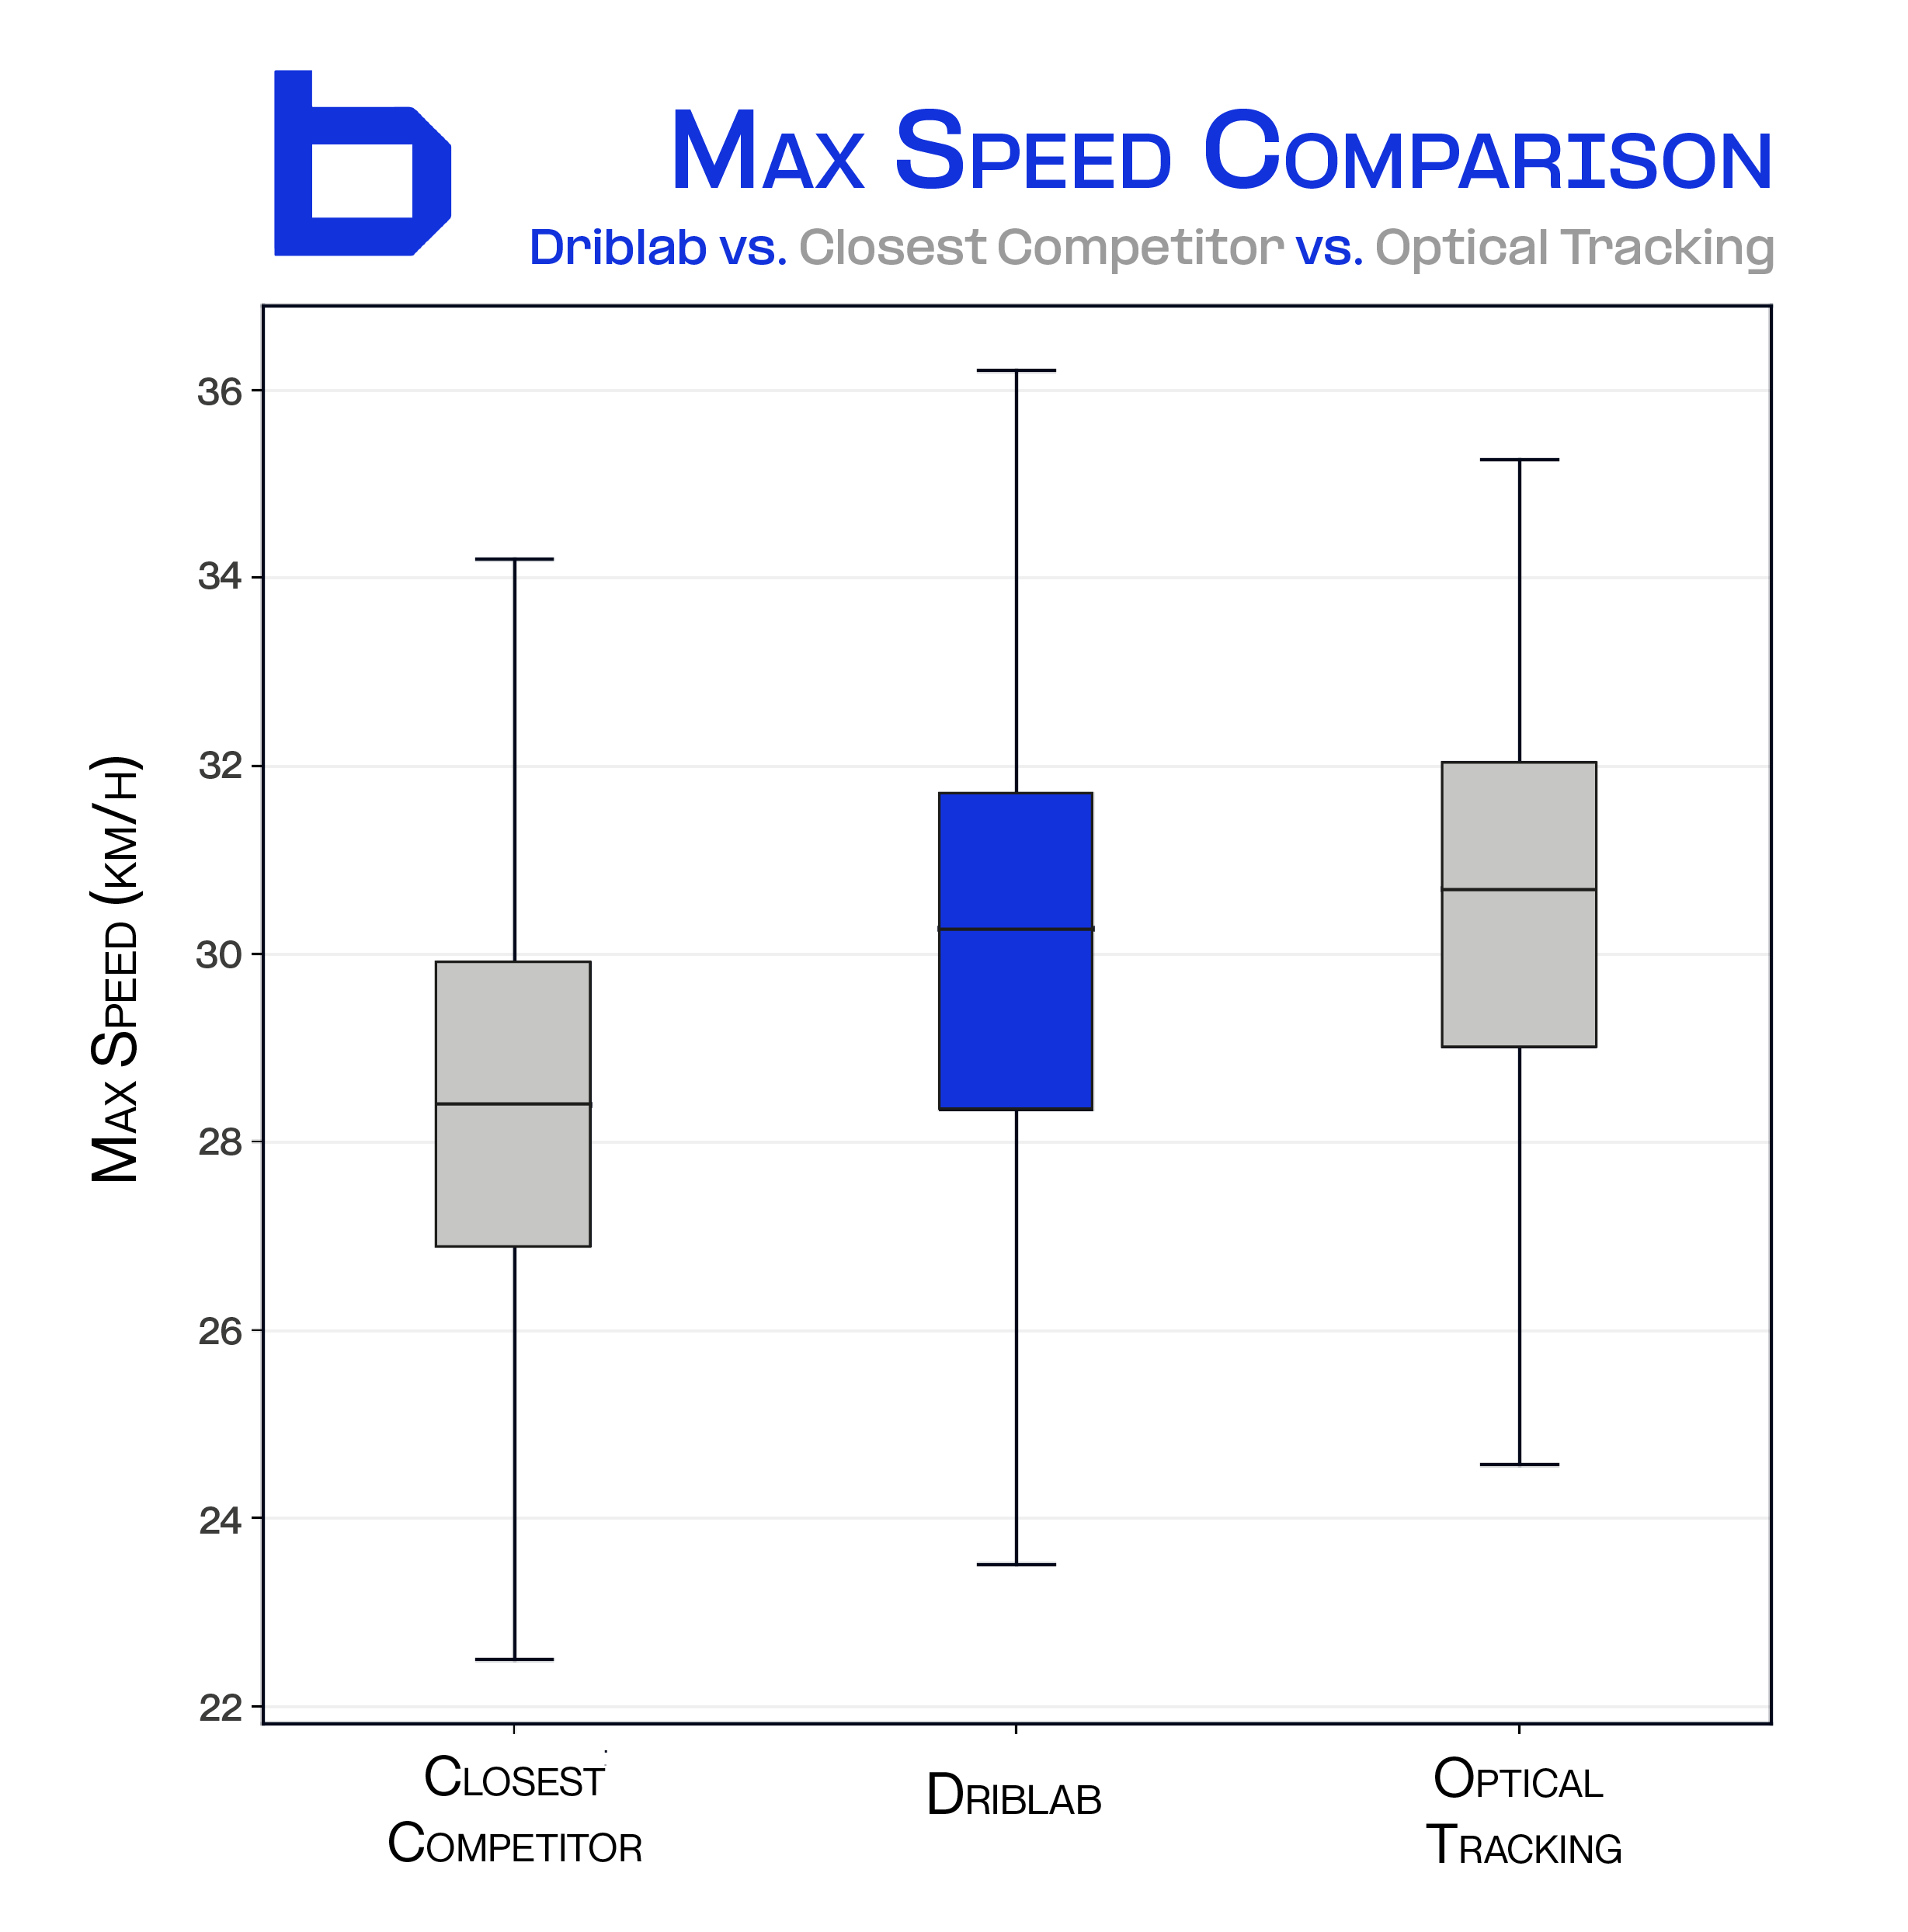
When comparing maximum speed values, Driblab’s measurements are substantially closer in magnitude to Optical Tracking than those produced by the closest competitor.
This strong alignment with the gold-standard reference demonstrates Driblab’s ability to capture peak player velocities with greater accuracy, delivering speed metrics that more faithfully reflect real match demands and enhance confidence in high-intensity performance analysis.
Across all physical dimensions analysed — total distance, high-speed activity, and maximum speed — Driblab consistently demonstrates a strong alignment with Optical Tracking data, widely regarded as the gold standard in elite football performance analysis.
Despite relying on broadcast footage, Driblab’s physical metrics show:
- Very high correlations with Optical Tracking.
- Comparable distributions in range and magnitude.
- Closer alignment than the closest competitor across key intensity and speed metrics.
Together, these results underline Driblab’s ability to deliver reliable, high-quality physical data from broadcast sources, empowering clubs, analysts, and performance staff to make confident, data-driven decisions without compromising on accuracy.