
How complicated is the pass I just saw on television? It is a question as simple as it is complex. With your powers of analysis and perception you may conclude that it is easy or difficult, or you may put an adverb in front of it to add some degree of difficulty or ease, but you can’t go too deep. There may be difficult passes that, with data in hand, become a real rarity that no one in a particular championship has been able to replicate.
One of the tasks and fundamentals of advanced statistics is to develop predictive and probability models that help to more deeply and accurately measure a concept or parameter of the game. In the case of passing, counting the percentage of successful passes or the percentage of long passes is fine, but we are a long way from measuring the true value that a player brings with his intentions, risks and successes. To begin to tell the story of how our Expected Passing % model is shaped, we will consider the following.
First, we collect basic geometric information about the pass and its location:
- X-coordinate of the start location of the pass.
- Y-coordinate reflected at the start location of the pass
- Angle of the pass based on the end location
- Approximate distance of the pass based on the final location
Next, we take into account whether:
- The pass was made with the feet or with the head.
- It was a pass in play, a set piece, a goal kick or a cross.
With this model and to understand and visualise the data, as with the Expected Goals model, we calculate the probability of a pass being successful, with 0 being a failed pass and 1 being a successful pass. If the model gives a value of 0.37 xP, then the pass had a 37% chance of being completed. Another way to read the metric is that if a pass had 0.10 xP then only 1 in 10 of that type of pass was completed. Let’s use a graphical example to support the idea.
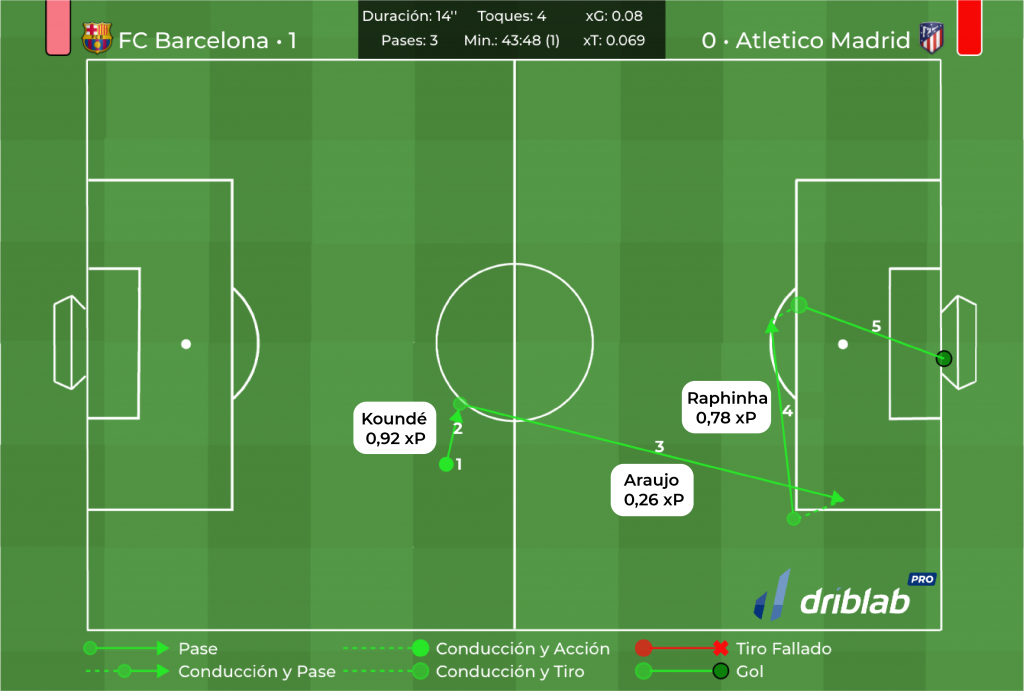
This map below is interactive. It corresponds to Barcelona’s 1-0 win over Atletico Madrid on matchday 30 of the 2022/23 Spanish league championship. If you hover your mouse over each circle, you will get more information about who made the pass. The play unfolds quickly: three passes are executed and a shot, by Ferran Torres, leads to the only goal of the match.
To see the play, in this Youtube link, from second 51, you can see the three passes and their level of difficulty, which we will then transfer to their corresponding value within the Expected Passes model. Taking into account the variables we described at the beginning of the text, each pass is given a value of probability of success.
The pass from Koundé to Araujo, with 0.92 (92% probability of completion).
Araujo’s pass to Raphinha, with 0.26 xP (26% probability).
And finally, the one from Raphinha to Ferran, with 0.78 (78% probability).
The metric contains the value of being able to know which players make passes of a higher or lower probability, thus relating the risk they take to their position, area of the pitch or daring to add value. For this reason, it is especially useful to extract the average for each player over the course of a competition to know, as in the Expected Goals per Shot metric, the average value of all passes made by the player. Here you will see that centre-backs, full-backs or midfielders have a very different average value.
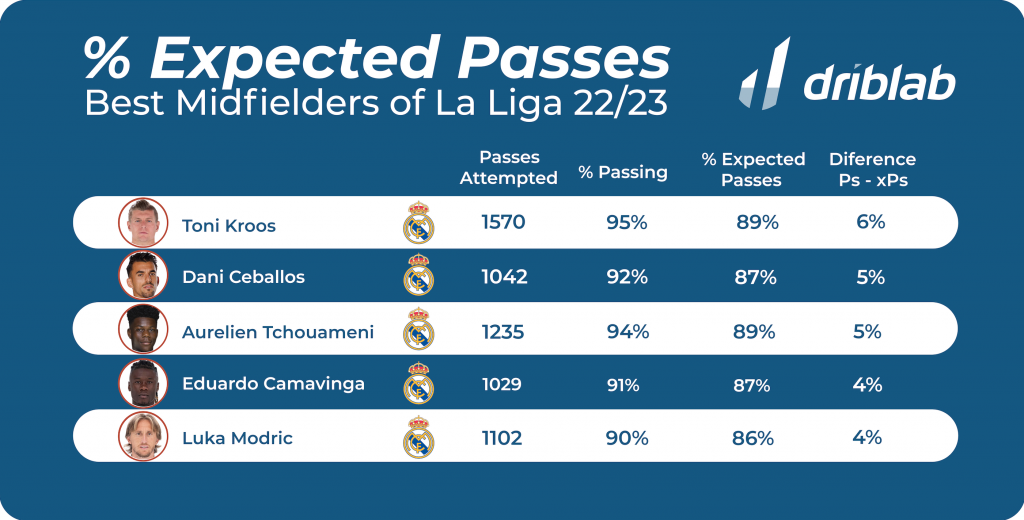
An interesting way to visualise who completes more passes than expected and how difficult, on average, the passes they make are, is with the following table. In it we see the best midfielders in Spanish La Liga 22/23, all belonging to Real Madrid, in the differential between expected passes and completed passes, both expressed as a percentage. If the most effective strikers have a very positive differential between goals and expected goals, the most accurate midfielders also have a very positive differential between passes completed and expected passes.
We are Driblab, a consultancy specialized in the statistical analysis of players and teams; our work is focused on advising and minimizing risk in professional football decision-making in areas related to talent detection and footballer evaluations. Our database has more than 200,000 players from more than 180 competitions, covering information from all over the world. Here you can learn more about how we work and what we offer.


