
In another recent text we have compiled the players who have improved the most according to our performance index, Driblab Score. But we wanted to leave out another of those players, the most improved player next to Vinicius, in order to individualise the different ways that we, as a data-driven consultancy, can show when explaining how a player has progressed.
If you follow the day to day world of football and the big five European leagues, to claim and count Christopher Nkunku as one of the most improved players is of little value, just look at any basic stats page and know that from 7 goals and 11 assists in the 20/21 season, he has gone to 31 goals and 20 assists so far, an unheard of transformation in such a short period of time. The value, therefore, lies in showing how he got there and what has happened to bring it about.
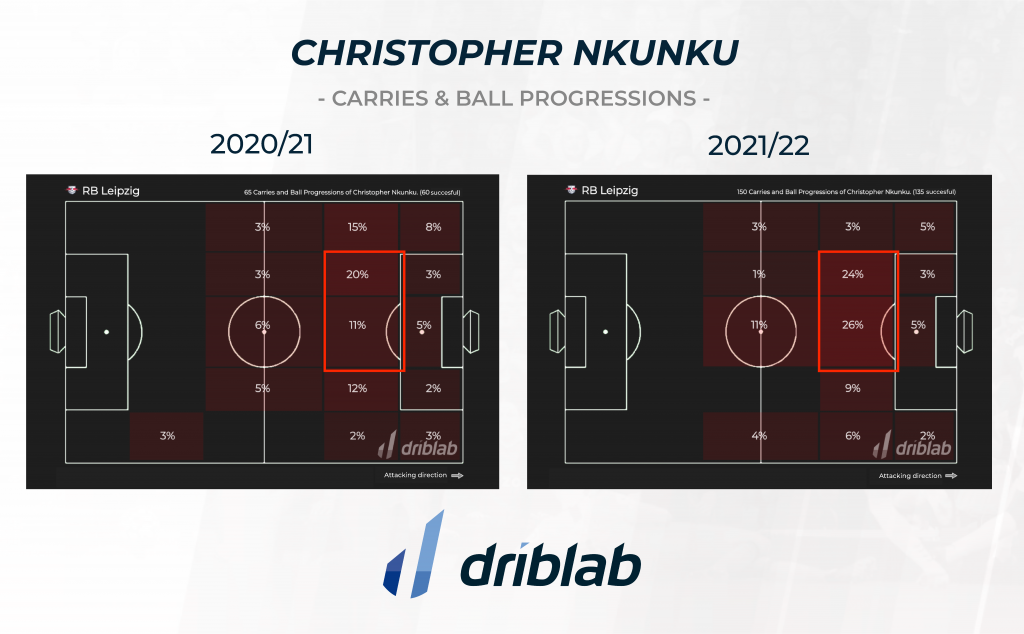
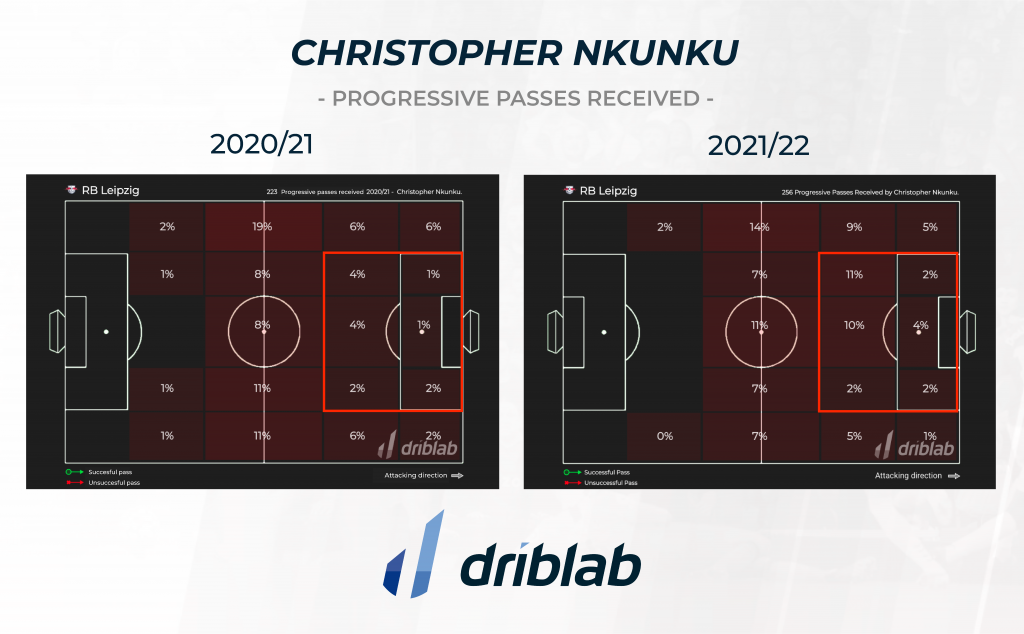
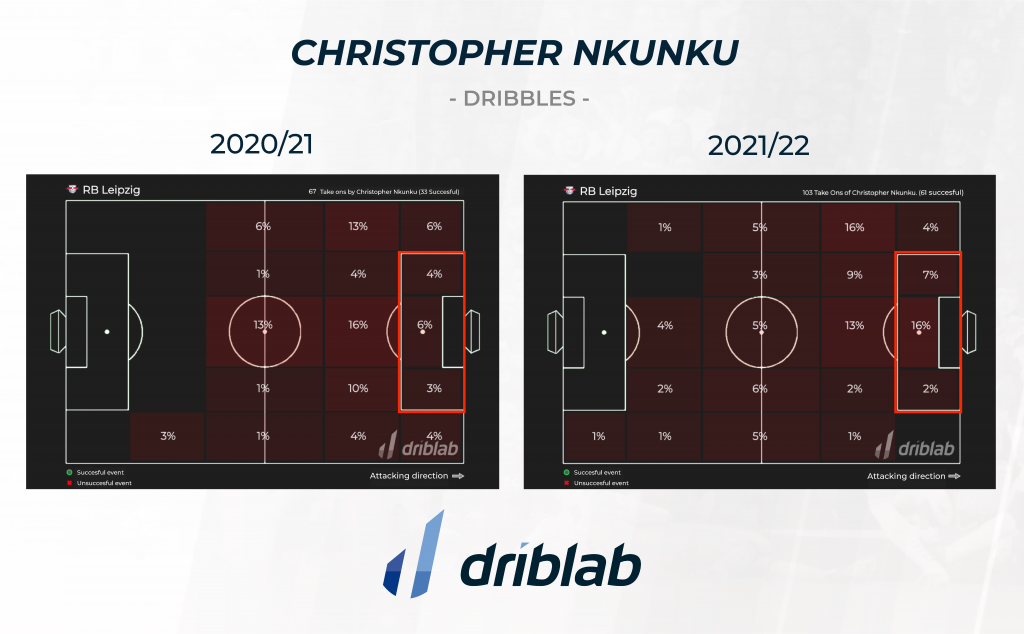
In a team that is constantly changing tactical design such as RB Leipzig, the big difference in this explosion of the French striker is that he has switched to playing as a striker without losing presence in all areas prior to finishing, as reflected in four visualisations: heat map, with more presence in the area; dribbling map, with more volume, success and areas where he dribbles, the conduction that ends in the area and the progressive passes received in the opponent’s half.
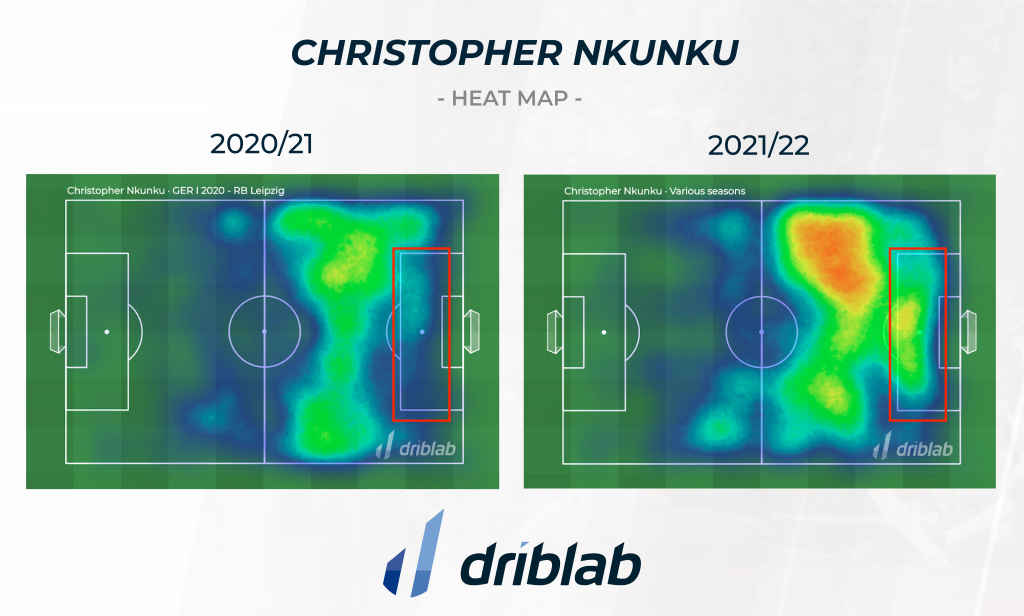
- Heat map: Nkunku is much more active in the box, directly or indirectly, with or without the ball. He is a much more aggressive and deeper player, finishing, dribbling or driving much more often.
- To know where he receives, we have the event ‘progressive passes received’, measuring the relevance and importance in his team’s inside connections, which looks much more continuously to Nkunku to create chances or turn defenders.
- On a purely individual level, after receiving the ball at his feet, he gets inside and drives not only many more times, proof of his ascendancy and confidence in his game, but much higher up, reaching inside the box more often, something we can also see in his dribbling map.
- Not only has the Frenchman attempted more dribbles (103 for 67 between the two seasons) but he has increased his dribbling percentage from 13% to 25% inside the box. A truly spectacular progression. In this way, with these four visualisations – and many more that we have – we can know which areas a player dribbles through, in volume and effectiveness, and in what way he faces the game and dares to drive, dribble, unmarked or receive between the lines.
Somos Driblab, una consultora especializada en el análisis estadístico de jugadores y equipos; nuestra labor se centra en asesorar y minimizar el riesgo en la toma de decisiones en el fútbol profesional en áreas relacionadas con la detección de talento y evaluación de perfiles. Nuestra base de datos cuenta con más de 180.000 jugadores de más de 180 competiciones diferentes, abarcando así información de equipos de todo el mundo. Aquí puedes conocer mejor cómo trabajamos y qué ofrecemos.


