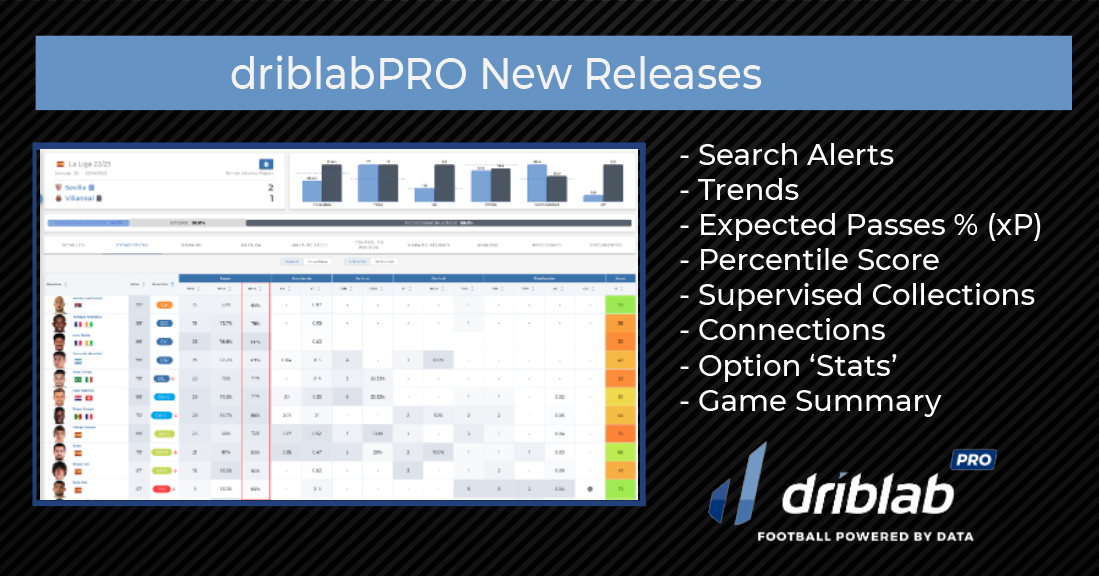
Over the last four months, Driblab’s technology team has developed new functionalities, tools and applications to continue offering the best service to scouts and sporting directors. We explain one by one all the new updates already available on our driblabPRO platform.
Search Alerts
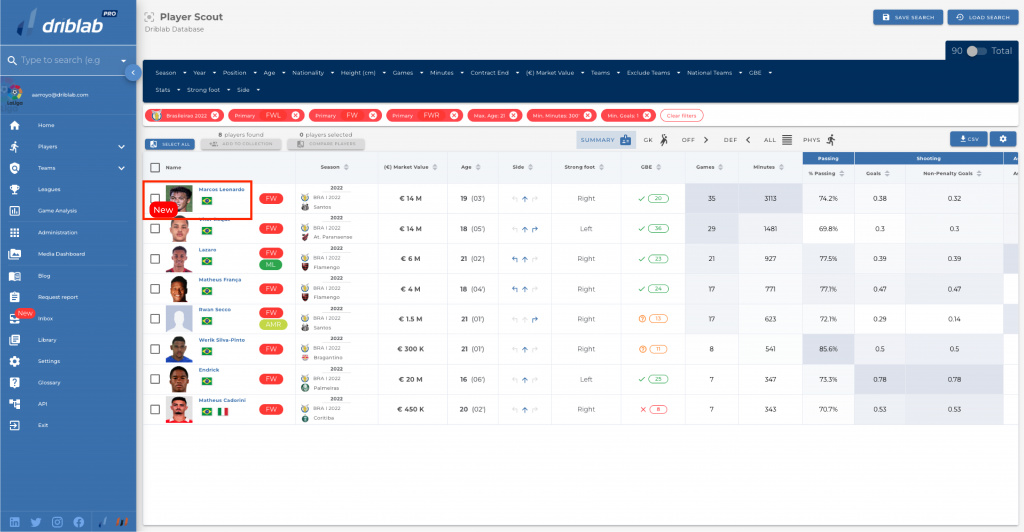
With ‘Search Alerts‘ we have the possibility to know when a player meets the requirements of a search we have made previously. Here we explain how to do this.
Within the player searches you make using the filters you are most interested in, you will be able to save the search and, after a while, when a player has fulfilled all the requirements you added in the search, you will receive an email notifying you that the new player has been added to the list. The player will appear with the “New” notice at the top of the list, as you can see in the following image.

Trends
Within the ‘Analysis’ section we have implemented a new tab where you can observe different competitive situations of the team in question: results dynamics (streaks), wins, clean sheets, goals in 1st and 2nd half, comebacks, comebacks conceded, average time winning, drawing or losing, types of goals and most outstanding players. A really complete section that will help us to know more, at a competitive level, our next rival or our own team.

Expected Passing %
Our last metric developed is called Expected Passes Percentage (xP), with which we measure the probability of hitting a specific pass depending on the starting location, the final location, if the pass was given with the foot or with the head or the type of pass attempted (in play, goal kick, cross or a set piece). In this text you have an extensive analysis and explanation of the metric, using concrete examples to contextualise its value.

Score by percentile
Driblab develops its own Score that allows us to evaluate numerically, from 0 to 100, the performance of a player. We have now also added the player’s percentile within all the players in his position and championship. In the example, we can see that Antoine Griezmann is in the 100th percentile, that is, the last percentile of all, where the best players are placed. In his specific case, by hovering the mouse over it, we can see that Griezmann is #1: the best striker in the Spanish Liga 2022/23.

Supervised collections
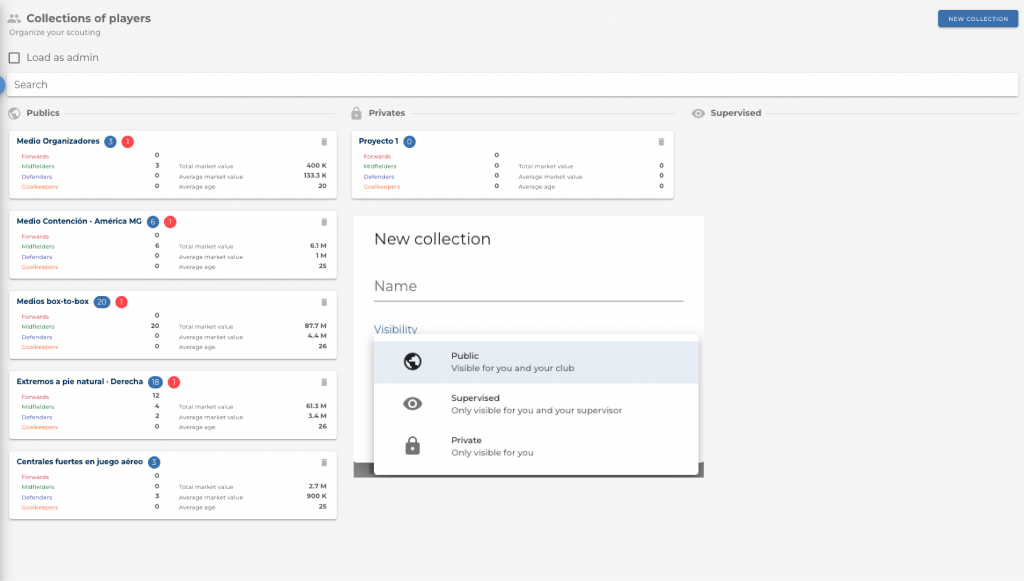
When we perform searches within the platform we can save all those searches in ‘Collections‘. Now, we can also create a collection that is only visible to your supervisor and not to everyone in your club, by selecting beforehand who it will be visible to. You choose who can see your player collections.

Connections
Another of the multiple possibilities already available in the ‘Analysis‘ tab is Connections. Here we can see the most repeated connections between players, the ones that have happened after a pass, that have generated xA (Expected Assists) and being filtered by type of play (in play, counterattack, set piece, throw-in, etc.).

Match statistics
Within a match card we could see, until now, the xG Maps, xA Maps, Passing Maps, Game Flow, Threat Map (xT) or Possessions in an interactive way, but now we can also consult numerical statistics, defensive and offensive, of all the players who had minutes in the match.

Match Summary
On the other hand, in the Details section, we can now also consult the statistical summary of the match, together with the line-ups, in four different tables: General, Attack, Defence and Contribution.

We are Driblab, a consultancy specialized in the statistical analysis of players and teams; our work is focused on advising and minimizing risk in professional football decision-making in areas related to talent detection and footballer evaluations. Our database has more than 200,000 players from more than 180 competitions, covering information from all over the world. Here you can learn more about how we work and what we offer.


