
Driblab launched two months ago the Expected Threat Map with the purpose to visualize the threat generation on football matches. Now we introduce the follow up tool, Player Threat Map, that gives the user the possibility to measure the threat generation of players over the course of selected seasons.
The information coming from this new tool comes in handy when preparing future matches against rivals. Knowing when, how and where the attackers of the rival will generate threat to your goal can become a real competitive advantage to use.
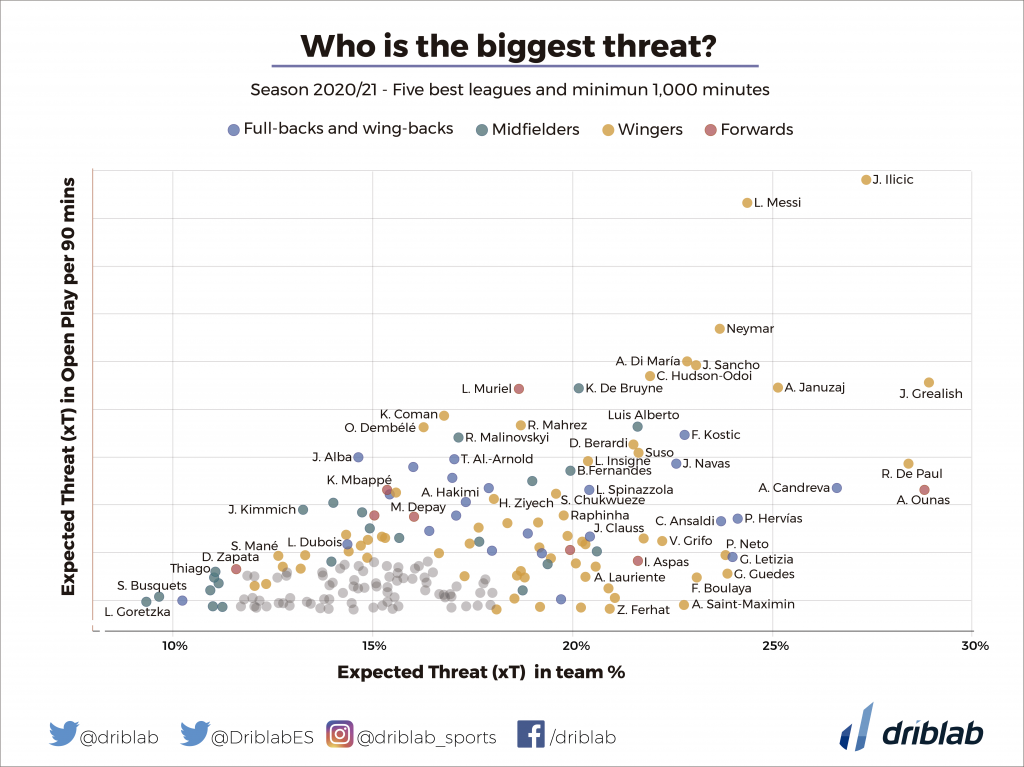
Coming back to this Driblab publication, and taking a glimpse to the top 5 leagues, some profiles are highlighted. Atalanta’s attacker, Josip Iličić, The Villains Jack Grealish and Bruno Fernandes, from Manchester United, will be addressed on today’s article.
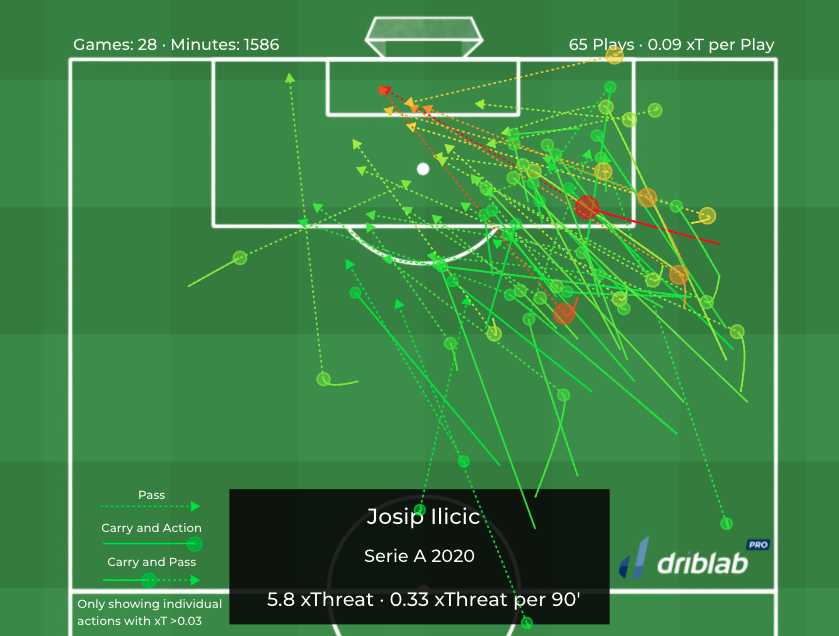
Josip Iličić – Top xT performer on the top 5 leagues from the right wing
Iličić has emerged as the top performer on Threat Generation (excluding Set Pieces) on this season, reaching a total of 0.33 xT per 90 minutes played. The above scatter plot clearly shows the massive distance against the rest of players despite only playing 42% of the minutes.
Taking a look at the field, the player has a significant weight on the right wing as starter point for his threat generation, eventually reaching into the box. The Slovenian player ended up with sheet of 4 goals (3.5 xG) and 9 assists (7.6 xA) on the Serie A this season.
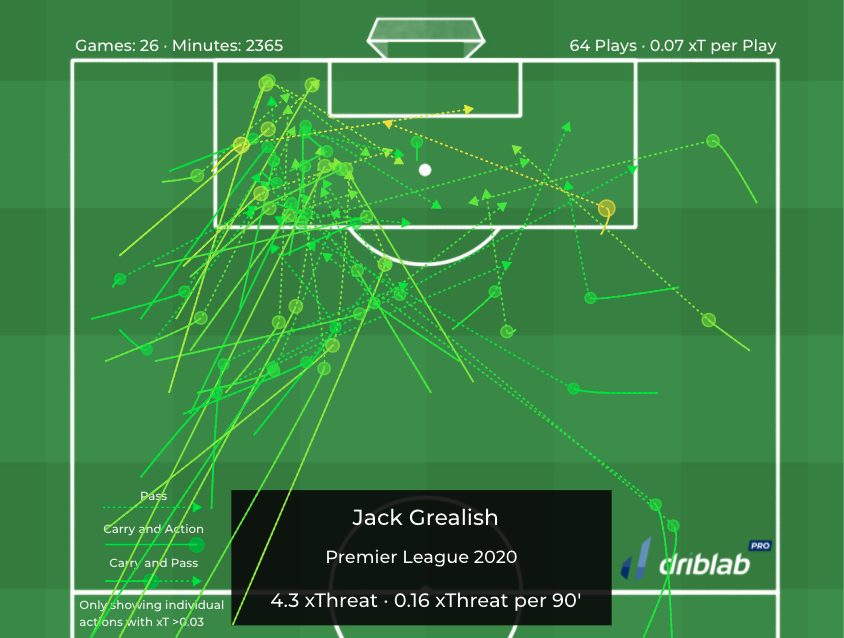
Jack Grealish – Highest team contribution attacking from the left wing
It is relevant to account for the great weight that Jack Grealish has within his team when moving the ball into more favorable situations for his team. Reaching a total of 0.16 xT per 90 minutes, his contribution covers above 28% of Aston Villa’s threat generation. This fact is even more remarkable if we recall that the player missed 12 Premier League games due to injury this season.
Just on the opposite side on the field of Josip Iličić, Jack Grealish influence clearly comes from the left side of the field and moving into the box, both from carries and from passes. Final numbers for him, 6 goals (4.6 xG) and 10 assists (7.8 xA).
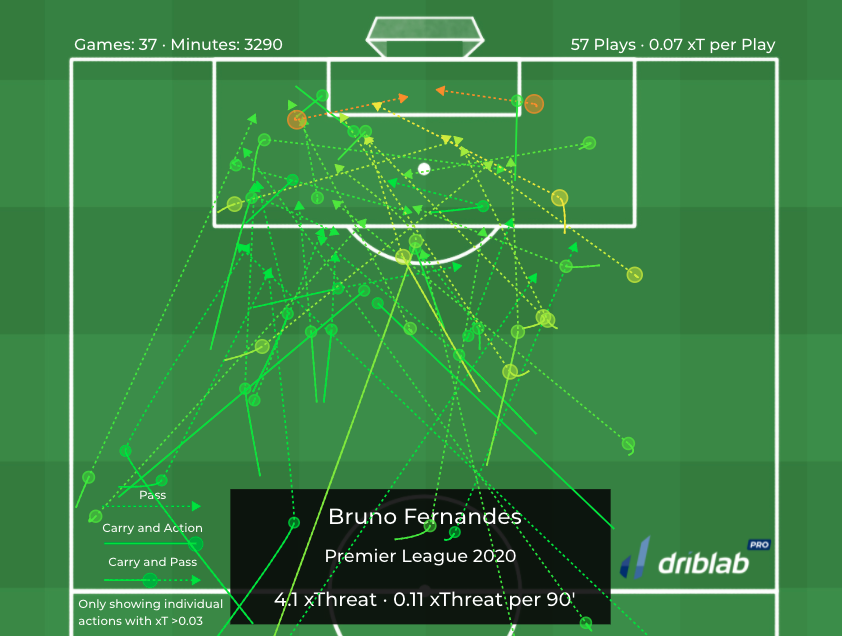
Bruno Fernandes – Attacking Midfielder focusing on the Center
Last but not least, Bruno Fernandes profile is worth mentioning. After scoring 9 goals (7.8 xG) and distributing 8 assists (9.4 xA), the Threat Map of the Portuguese displays the characteristics of a player that does not seek out the wings to generate danger, but rather the opposite, attacking through the center of the field.
The top Manchester United contributor, accounting for a total of 20% of the team’s Open Play xT managed to average 0.11 xT per 90 minutes of game.
We are Driblab, a consultancy specialized in the statistical analysis of players and teams; our work is focused on advising and minimizing risk in professional football decision-making in areas related to talent detection and footballer evaluations. Our database has more than 130,000 players from more than 120 competitions, covering information from all over the world. Here you can learn more about how we work and what we offer.


