
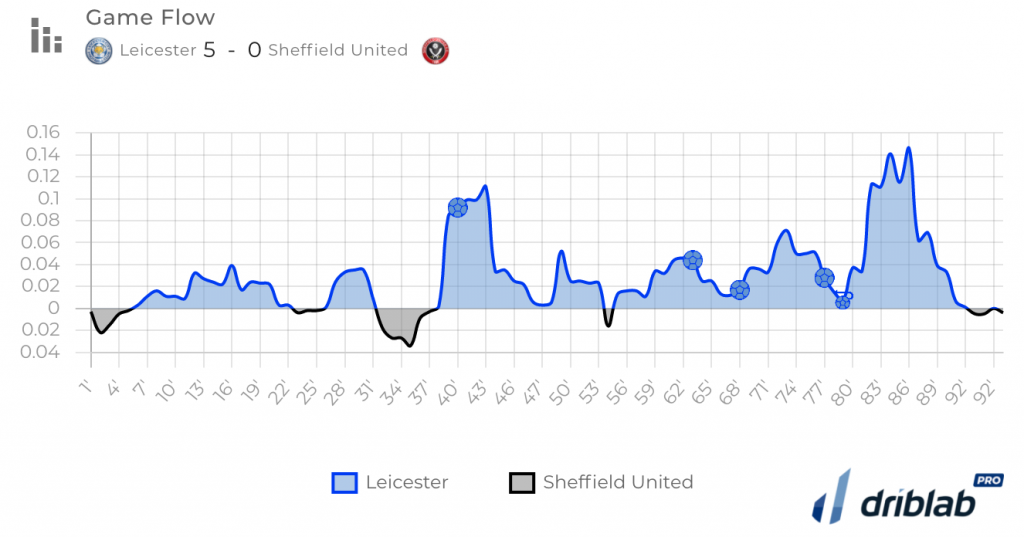
Last Sunday’s outstanding performance of the Foxes led by the former Citizen Kelechi Iheanacho, scoring his first career hat-trick, resulted in an impressive 5-0 win against the Premier League bottom-ranked Sheffield United. In the top continental competition, yesterday Real Madrid advanced to the next round with a comfortable 3-1 win over Atalanta, summing up a total aggregate of 4-1.
The tool previously released, the Game Flow chart, shows Leicester City’s superiority on the pitch throughout the 90 minutes, especially in the second half of the match. This game control was directly reflected in the final scorecard, far surpassing the 1.3 expected goals the Foxes are averaging when playing at the King Power Stadium.
To further evaluate the dominance of the local team, Driblab presents its new game analysis tool: Expected Threat Map. The interactive feature allows to display the moves that generated the highest threat for the opponent, providing efficient support to understand the game flow of the match.
Filtering which types of actions want to evaluate, how the action ended, on which time range or even how much threat was generated allow to get a more specific map for deep analysis. Am I generating threat through set pieces? Is my danger creation stable across the 90 minutes?
When reading the map, a solid line on the field represents a ball carry-on, while a dotted line shows a pass. The circle indicates an event (pass, shot, foul or other). The combination of these 3 describe the full action. The higher the Expected Threat of an action is, the redder and bigger the point appears in the chart, allowing to identify the most dangerous moves.
The highlighted example shows a move by Jamie Vardy carrying the ball into the opponent’s area and giving a pass to Iheanacho, who receives the ball and eventually misses the shot.
The Expected Threat measures how the probability of scoring a goal changes before the action and after it, giving value to actions that lead your team towards more dangerous situations. The metric awards points to an action given its starting position on the field. In the Leicester play, the key pass of Jamie Vardy had an expected threat of 0.158. That is, the English player made the play 15.8% more likely to result in a goal.
In yesterday’s match in which the team led by Zinedine Zidane won 3-1 against the team originally from Bergamo, the Expected Threat generation was ultimately tied. Despite having Luis Muriel, the player who created the most danger in the match, Atalanta was not able to convert this threat generation into real goals.
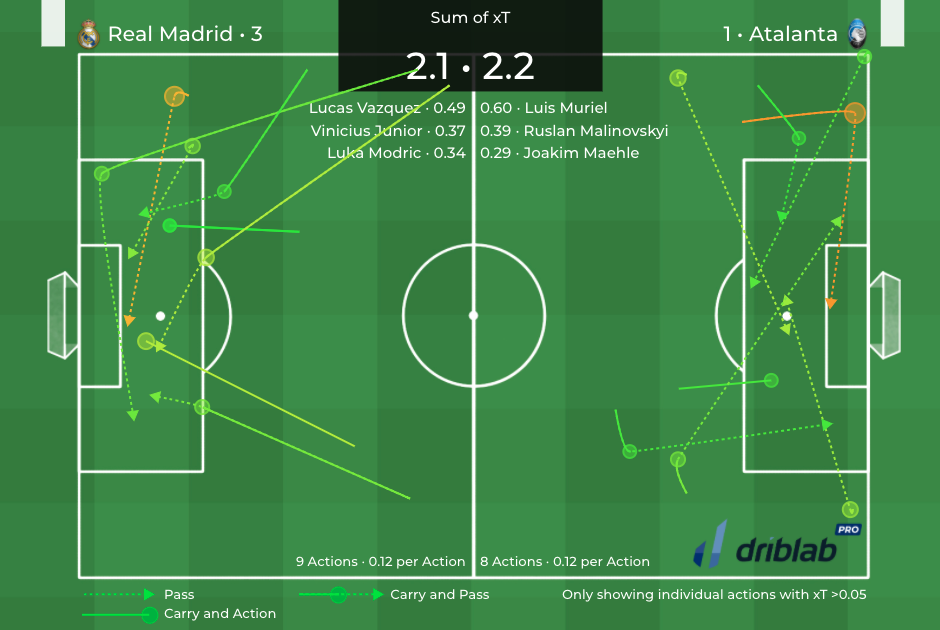
An interesting insight to be noted is how Real Madrid generated almost all of its Expected Threat through long ball carries followed by passes. In the opposite side, Atalanta focused on not so vertical actions and less ball retention moves except for the carry and pass of Luis Muriel in the second minute of the match towards Robin Gosens.
The Brazilian Vinicius Junior’s brilliant action is worth to mention. After a ball recovery in defensive positions and a 70-meter-long run, the young striker dribbled every defender that stood in his way. Unfortunately, after making all the difficult steps, he failed at the very last moment in front of Marco Sportiello.
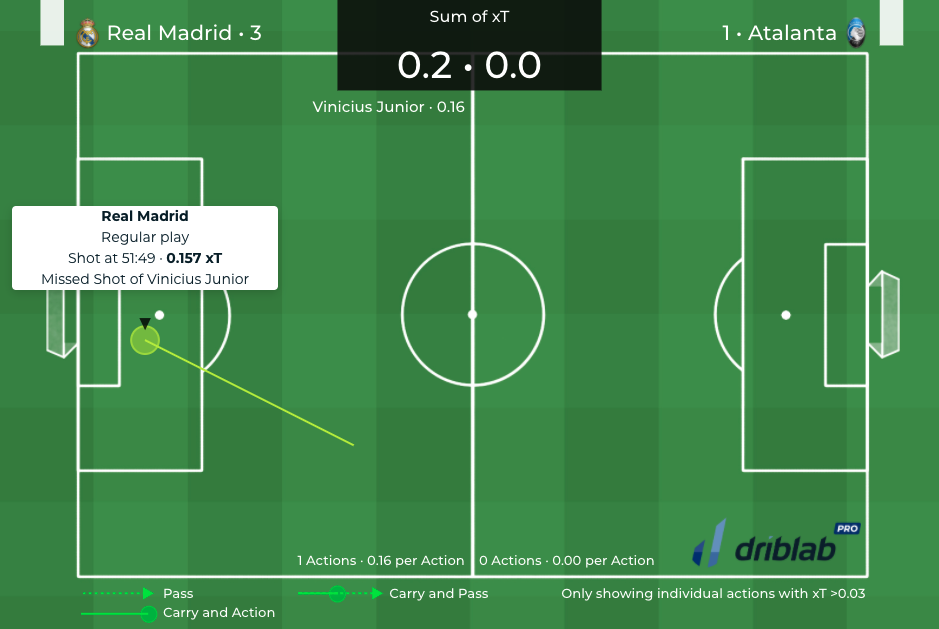
Again, thanks to the Expected Threat Map, Driblab users identify that Vinicius generated 0.157 of Expected Threat by carrying the ball into the opponent’s area and shooting in front of the goalkeeper. This opportunity ranked as the 3rd play of the match regarding threat generation.

With this new solution, the user is capable of understanding where the threat generation towards your rival is coming from and which player created it. Besides, identifying whether a player is more dangerous when carrying the ball or passing it is also an important aspect to consider when analyzing a team or a player.
We are Driblab, a consultancy specialized in the statistical analysis of players and teams; our work is focused on advising and minimizing risk in professional football decision-making in areas related to talent detection and footballer evaluations. Our database has more than 180,000 players from more than 180 competitions, covering information from all over the world. Here you can learn more about how we work and what we offer.


