
During the last World Football Summit we talked about the importance of data in the sports industry, now, following our will to keep creating insightful tools to help you understand football games from a data-driven perspective, today at Driblab we introduce our brand-new Game Flow Chart that seeks to take us through the different phases of a game in terms of who was generating a higher threat to the rival.
To understand what we are measuring here, we want you to try to put yourself in the boots of any defender of your favorite team; there are some areas of the pitch where, if you want to keep your job, you better keep the ball away. Namely, the areas closer to the goal you are defending. Using our large database of games, we can say that, if the opponent team receives the ball within the six-yard box, the chances of that play to end up in a goal are around one out of two times. Instead, if that ball is received at the edge of the box, the chances go down to 5%, so only one out of 20 plays will result in a goal. So, if a player is able to move the ball from the edge of the opponent box (5% goal-chance area) up to the six-yard box (50% goal-chance area), we can say he added 45 percentage points of danger to that particular play.
For a play to add percentage points to a team, it has to end gracefully. The only ways a play can end gracefully are by actions that keep the possession of the ball (i.e successful pass, foul received, etc…) or any kind of shot. Our model is influenced by previous work done by Opta with its Possession Value metric and the already well known Expected Threat by Karun Singh. Yet, our model differs in some ways. First off, our actions are counted as single and isolated efforts instead of being attached to a possession (by the way, does anyone know what a possession is?). We also use a large dataset of actions to better measure probabilities in each area, and add bilinear interpolation to our model to quantify, with a higher degree of accuracy, those plays that do not start or end exactly from the center of an area, creating a continuous mesh of the pitch as if it was a gravitational field. We also take into account in what way a play ends; certainly, it is not the same (with regard to the threat generated to the opponent) to cross a ball to the penalty spot than to provoke a penalty by carrying the ball to the opponent box. The two actions will place the ball at the same spot for a teammate to try to score, but they have quite different chances to end up in a goal.
Straight to the point, this is the Game Flow Chart of Madrid’s derbi:
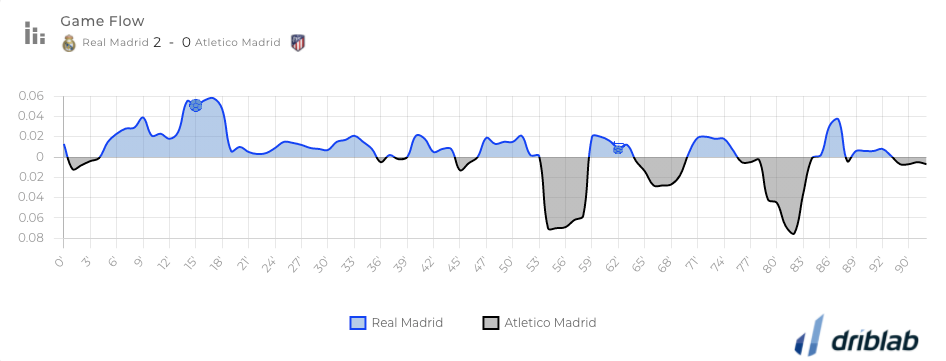
You can see how Atletico de Madrid slightly started controlling the game: that’s due to a dangerous pass by Koke at the 1:26 mark to the edge of the box. After that, we see how Real Madrid controls the game for the rest of the first half, even after the first goal, moment when they have the highest degree of control. During the second period the control of the game, in terms of threat generated, seems more even: we see a first peak of Atlético up to 0.075 coming from an excellent pass from Marcos Llorente to Tomas Lemar that ends in a shot very close to Courtois right post. The second peak comes with the cross of Lodi that Saúl heads but Courtois defuses with a great save.
The lines of the graph are smoothed using a moving average of the difference of danger created by each team: we calculate the difference in the danger created so that the control belongs to either one team or the other at any given moment.
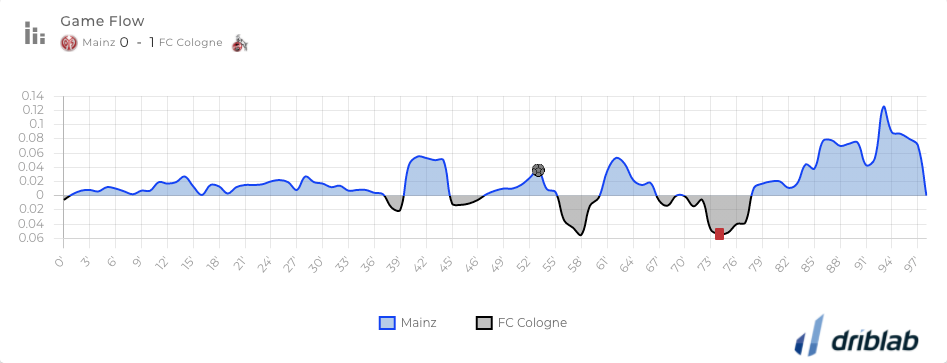
Another great example would be the Mainz vs Cologne game played last Saturday. We can see how Cologne’s goal came during a phase where Mainz was controlling the game, but a possession lost by Mainz and the consequent fast break by Cologne led to the first and only goal of the game. A couple of minutes after a great chance for Cologne to score the second goal, Ondrej Duda would get a red card that would swap the domination of the game to Mainz. During that last phase of the game, Mainz would generate 113 percentage points of danger, that would convert into 0.81 expected goals in 8 shots but none of them resulted in a goal.
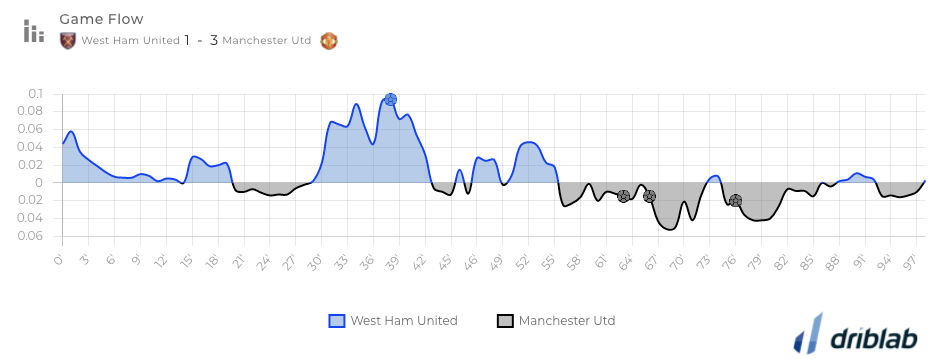
Next Game Flow Chart shows the comeback of Manchester United against West Ham United. We see a first half with slight changes of control during the first half an hour of the game. West Ham would take over during the next fifteen minutes with many plays where they would reach dangerous areas leading to 9 shots and the first goal of the game. The second half belongs to Manchester United in terms of control of the game; although the superiority doesn’t seem to be as clear, it was enough for the Reds to get the win.
We are Driblab, a consultancy specialized in the statistical analysis of players and teams; our work is focused on advising and minimizing risk in professional football decision-making in areas related to talent detection and footballer evaluations. Our database has more than 150,000 players from more than 180 competitions, covering information from all over the world. Here you can learn more about how we work and what we offer.


