
Probability applied to football draws that fine line that this sport so easily breaks and invalidates: that of deservedness. In its favour, if we extrapolate a result based on what we saw in the corresponding match, we can draw conclusions through simulation, managing to reduce the chance component as much as possible. Between the statistical probability, the actual result and the deservedness for all that has been produced, a question arises:
How many points should each team have won in each match?
To answer this question, the Expected Points (xP) was born.
This metric tries to build a long term deserving approach based on what is generated through Expected Goals. Football is a sport where many factors come together and where the result can be the result of the most obvious, but also of the most unnoticed. In the end the reality is the actual goals and points, but advanced statistics can argue that things could have happened differently or that a team is more likely to win if they continue to generate more than their opponents. Luck or inspiration cannot be trapped or manipulated and is often more important than any other factor.
The Expected Points (xP) model starts from the Expected Goals of a match. Once we have the xG of each team, we elaborate, through a distribution model, what would have happened if we simulated the same match thousands of times, getting to know, precisely, what probability each team would have to win, draw and lose with the same expected goals generated. In this way, we obtain a probability percentage for each team and sign (win, draw, opponent’s win).
After simulating with the distribution model and multiplying each percentage obtained by the value of each sign (win, draw, opponent’s win), we would obtain the expected points of that match if it happened thousands of times. And therefore, we would obtain a form of deservedness that becomes really useful when the teams have already crossed the halfway point of the competition or at the end of it.
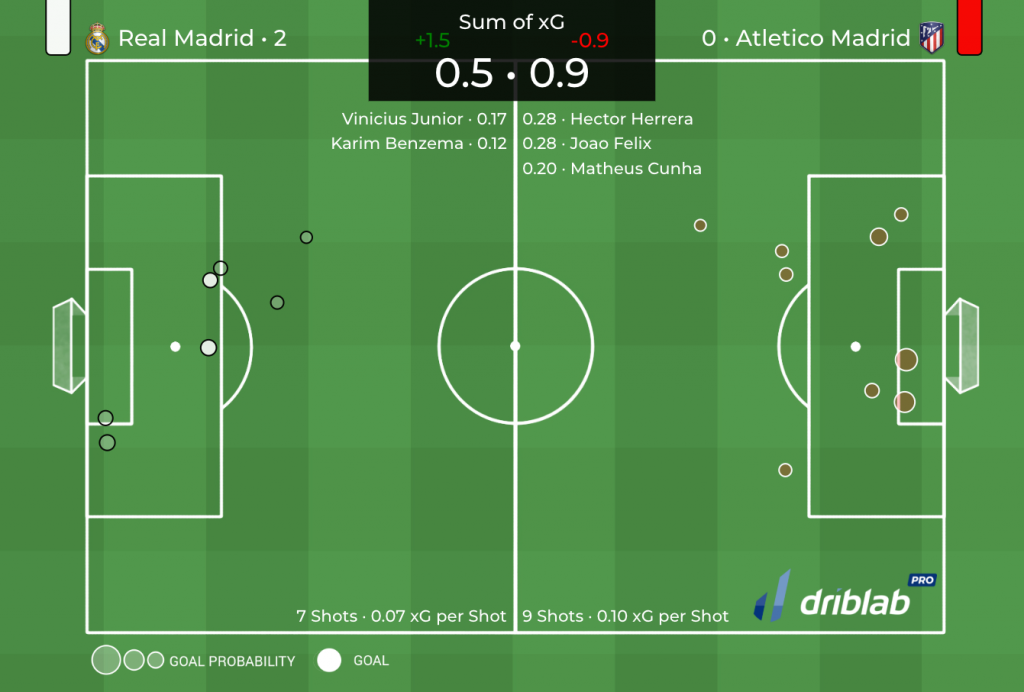
As we see in the xG map of the Real Madrid-Atletico Madrid match above, Carlo Ancelotti’s side generated 0.5 xG and scored two goals, while Atletico generated 0.9 and scored none. This same match, simulated thousands of times, would generate percentages for each sign and expected points very different from the result that occurred. Knowing that football depends on these factors, such as being accurate and clinical in scoring and saving, as well as luck, with Expected Points (xP) we try to give an answer to the long term deservedness if the matches had a similar trend in terms of Expected Goals.
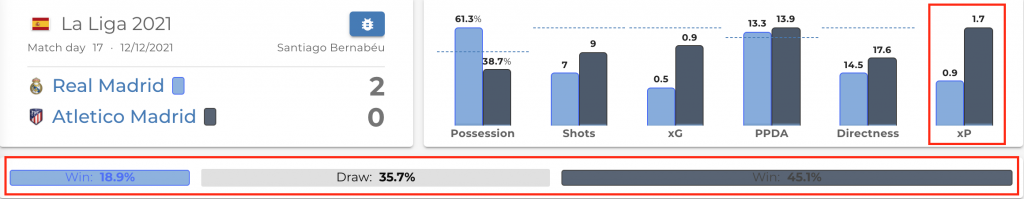
On our driblabPRO platform, we count, within each match card, the winning, drawing and winning percentage of the opponent by simulating that match thousands of times and how many Expected Points (xP) are awarded to each team. In the red boxes we see that a match with these Expected Goals simulated thousands of times would give an 18.9% win rate to Real Madrid, a 35.7% draw rate and a 45.1% win rate to Atlético Madrid, reflected in the Expected Points (xP): 0.9 for Real Madrid; 1.7 for Simeone’s team.
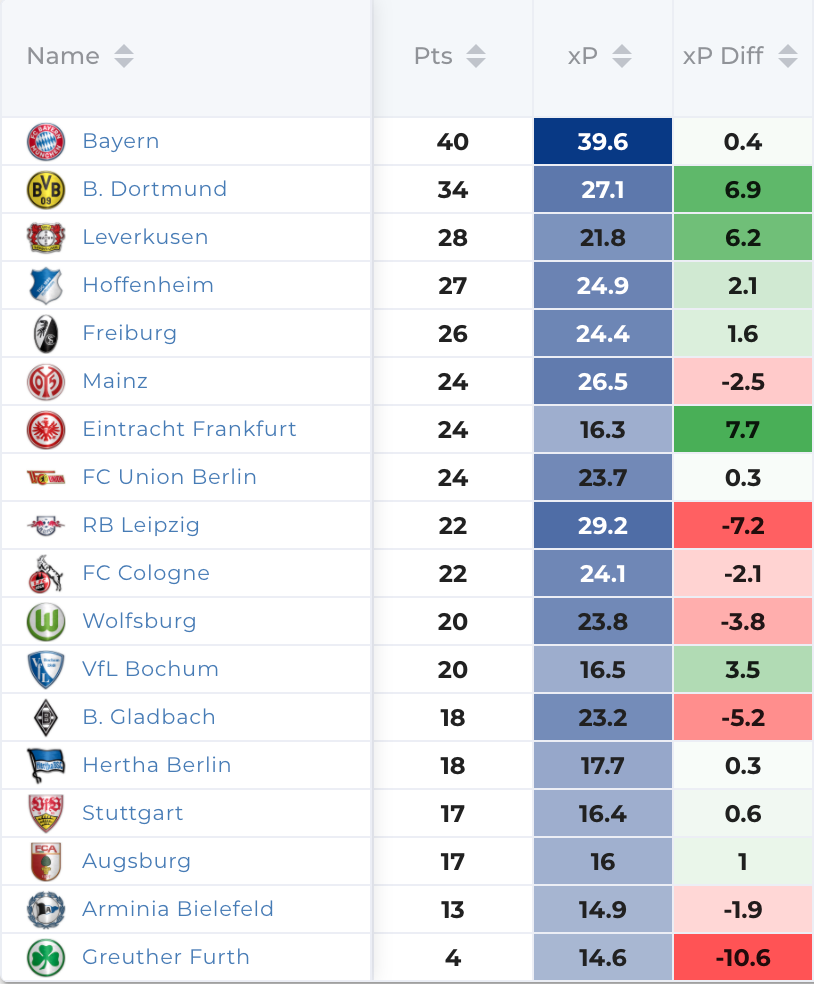
In our database we have a ranking of Expected Points in all the leagues we cover. As we usually do, we will use an example, in this case the Bundesliga, to see how many points each team could have obtained and how many they actually have so far.
We are Driblab, a consultancy specialized in football analytics and big data; our work is focused on advising and minimizing risk in professional football decision-making in areas related to talent detection and footballer evaluations. Our database has more than 180,000 players from more than 180 competitions, covering information from all over the world. Here you can learn more about how we work and what we offer.


