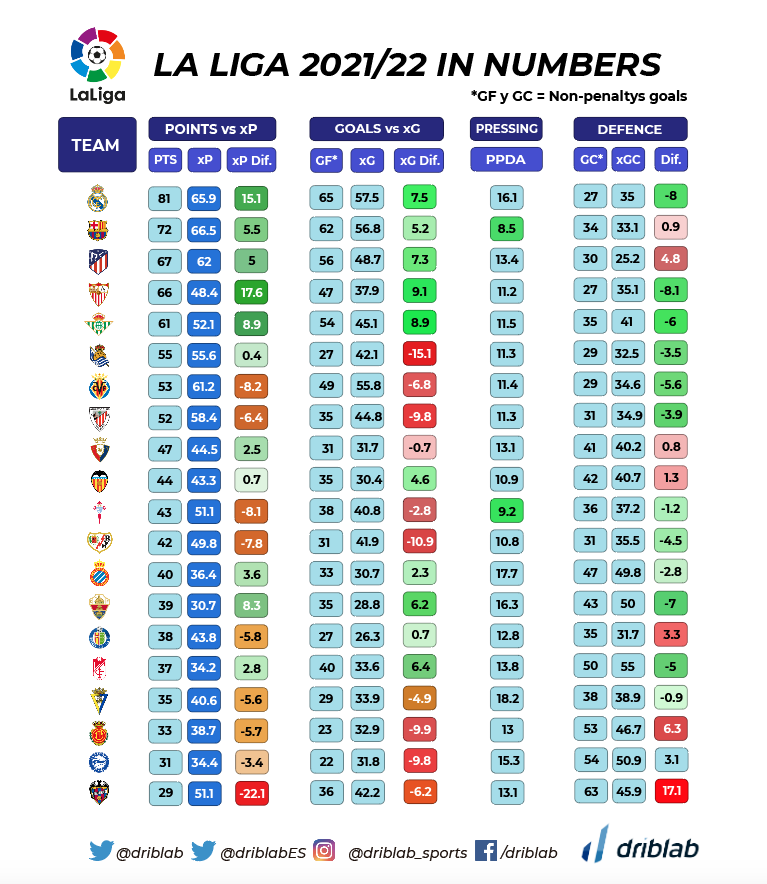
With two rounds to go, La Liga has yet to know which teams will be relegated, which fourth team will play in the Champions League alongside Real Madrid, Barcelona and Atlético de Madrid, and which teams will play in the Europa League and Conference League. However, what we can know is how each team has performed statistically. In order to have direct access to more relevant information, we have taken four advanced statistics that will answer four specific questions:
- Expected Points (xP): how many points did each team earn in relation to the points they deserved?
- Expected Goals (xG): What was the scoring effectiveness of each team between what was scored and what was generated?
- Pressure (PPDA): Which team pressed more and which team pressed less?
- Expected Goals Against (xGC): How many goals did and should each team statistically concede?
The Expected Points (xP) model starts from the Expected Goals of a match. Once we have the xG of each team, we elaborate, through a distribution model, what would have happened if we simulated the same match thousands of times, getting to know, precisely, what probability each team would have to win, draw and lose with those same expected goals generated. In this way, we obtain a percentage of probability for each team and sign (win, draw, opponent’s win).
For its part, the famous Expected Goals (xG) model is a metric that analyzes the quality of the chances that take place in a match. Each shot has a value that shows the probability of becoming a goal. This number is the percentage (0.1 xG means that this shot ends in a goal 10% of the time) that is assigned according to the place of the shot, the distance to the goal and the angle, as well as the part of the body (head, foot or others) with which the ball is shot, adding to the variable the speed of the play, the pass that precedes the shot, etc.
The PPDA model (Passes per Defensive Action) measures the number of passes that a team allows the opponent to make before trying to steal the ball with a defensive action (tackle, interception, recovery). This is why it is an inverted statistic: the lower the number of passes in the statistic, the more a team presses, as can be seen in the table below.
Finally, the Expected Goals Against model is the inverse of Expected Goals, measuring what opponents generate for a team, i.e. the goals it should have conceded by probability and the goals it finally conceded, establishing a way to measure which team concedes above or below the expected, with the performance of the goalkeepers having a great influence.

This is our ranking, as of May 12, 2022, of the twenty teams in the 2021/22 League in relation to these four specific metrics:
From the table we can establish the huge impact of Sevilla in what we can call over-scoring in relation to merit, thanks to their great goal-scoring effectiveness within matches where they did not generate great chances or excessive danger, being the most effective team in the championship in relation to what was generated, with a differential of +9.1 in goals scored and goals expected. Teams in the opposite place, Levante, who scored 22 points than they deserved, and Real Sociedad, who scored 15 goals less than they generated.
In terms of pressing, Xavi’s Barcelona and Coudet’s Celta were the teams that pressed the most, with less than 10 passes that the opponent was able to give in each of their possessions, with Cadiz and Espanyol being the most passive sides defensively.
In terms of defense and goalkeeping, Sevilla and Real Madrid are listed with a -8 between goals conceded and expected goals against, thanks to the extraordinary performance of the two best goalkeepers of the championship, Thibaut Courtois and Bono. At the other extreme, the discreet season of Jan Oblak, who did not go through his best moment during the first round of La Liga, as well as the numbers of Levante, who conceded a lot of goals during almost the entire championship. Elche and Betis, also with very good numbers.
We are Driblab, a consultancy specialized in the statistical analysis of players and teams; our work is focused on advising and minimizing risk in professional football decision-making in areas related to talent detection and footballer evaluations. Our database has more than 200,000 players from more than 180 competitions, covering information from all over the world. Here you can learn more about how we work and what we offer.


