Having passed the halfway point of MLS 2022, and after confirming the great level shown by the U21 talents we pointed out a few months ago at the beginning of the championship (Talles Magno, Julian Araujo, Jesus Ferreira or Gabriel Slonina), we are going to know what is happening at a collective level according to the database and metrics developed by Driblab, with Los Angeles FC as the clear dominator in the Western Conference.
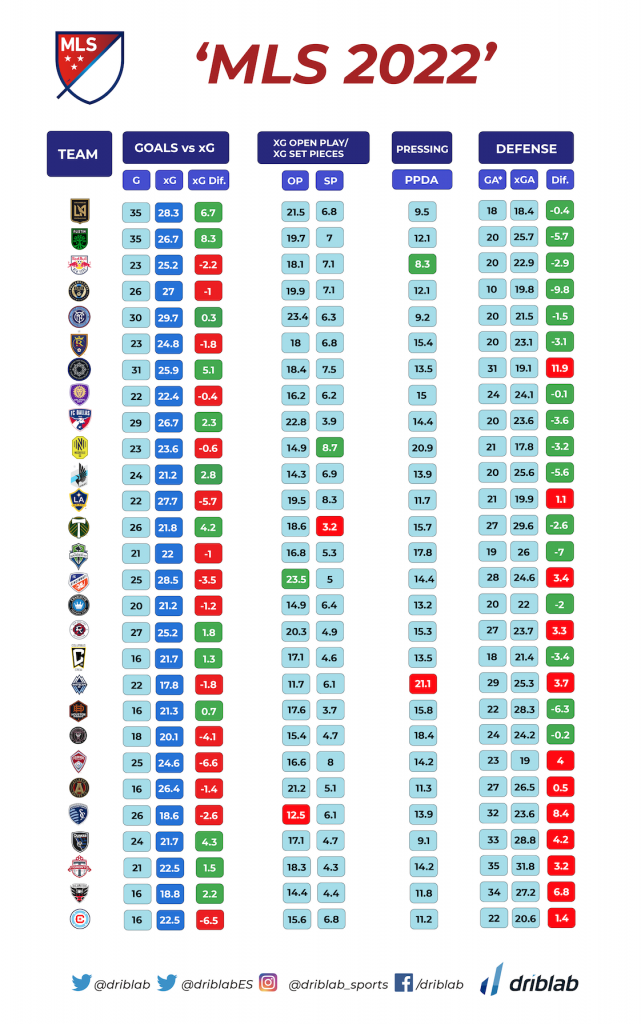
And it is, as is usually the case in the vast majority of cases, because their goal scoring efficiency is very high, specifically the second best in MLS, with a goals scored differential (without penalties), over expected goals, of +6.7 (28.3 Expected Goals) On the other hand, Colorado Rapids (-6.6), Chicago Fire and Los Angeles Galaxy (-5.7) are the three MLS teams with the worst effectiveness ratio, scoring below what is expected given the clarity of the chances.
Defensively, using our xGOT metric (Expected Goals on Target) or also called ‘Goals Prevented’, as the goalkeeper has a direct impact, the team that has prevented more goals taking into account the placement of the shots and, therefore, the probability of conceding a goal from those shots, is Philadelphia Union, with a -9.8 (they have conceded almost 10 goals less than they should have given the chances they have generated. Their goalkeeper, Jamaican Andre Blake, is performing spectacularly.
It is also interesting to see which teams generate the most chances from set pieces and which teams get the most out of their set pieces, dividing the Expected Goals (xG) generated between the two metrics to see how teams perform in both situations.
Thus, FC Cincinnati is the MLS team that generates the most xG in open play, while Nashville is the team that generates the most threat and chances from set pieces (free kicks and corner kicks). Nashville is also the team that is most dependent on set-pieces as a percentage of the total, with 36.7% of their Expected Goals coming from set-pieces.

Conversely, the team currently generating the fewest xG in open play in all of MLS is Vancouver Whitecaps, with just 11.7. On the other side, Portland Timbers have only generated 3.2 xG from set pieces, having the worst record in this facet of the whole championship.
In terms of style of play, we considered it interesting to reflect the percentage of ball possession, as well as the PPDA (Passes per Defensive Action), to measure which teams press more and try to harass the opponent with more intensity. This metric, as we have seen in previous analyses, measures the passes he gives to the opponent before being pressured, so the fewer passes in the statistic, the more pressure is applied.
Our data shows that San Jose Earthquakes have the ball longer than anyone else at 59%, 19% more than the team with the least possession, which is none other than Philadelphia. In terms of putting pressure on the opponent, New York Red Bulls allow their opponents 8.3 passes per possession, making them the team that puts the most pressure on their opponents, true to the style that characterises all of the brand’s teams. In terms of possession (41%), Vancouver is also the team that puts the least pressure on the opposition, with a PPDA of 21.1 passes.
We are Driblab, a consultancy specialized in the statistical analysis of players and teams; our work is focused on advising and minimizing risk in professional football decision-making in areas related to talent detection and footballer evaluations. Our database has more than 200,000 players from more than 180 competitions, covering information from all over the world. Here you can learn more about how we work and what we offer.


