
This coming Sunday, November 20, the Qatar 2022 World Cup kicks off, perhaps the most atypical of all, among other things, because it will be played in the middle of the season for many local leagues. In order to get to know each team, both in terms of performance and style of play, we have selected eight metrics with which to answer various questions:
- Which team attacks the most vertically, and which team elaborates its attacks the most?
- Which team is more effective between what it generates and what it scores?
- Which team presses more intensely and which team recovers higher?
- Which team generates more from set pieces?
Although the playing contexts are very different, forcing quite a few teams to play a very different role to the one they played in the qualifying phase (such as Qatar, Saudi Arabia, Japan or Iran, which will be inferior teams when they were dominant in their qualifying matches), the truth is that all these metrics bring us closer to a way of playing and a performance that has been sustained during their respective qualifying rounds.
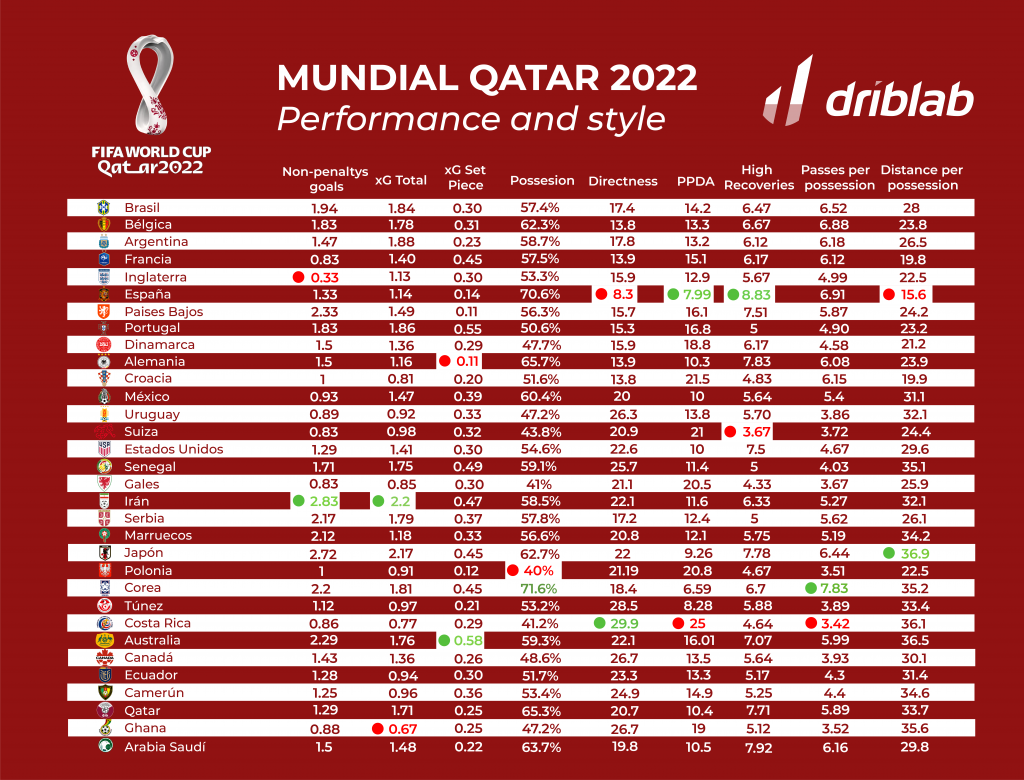
This table reflects, for example, Spain’s intense dominance of the ball, possession and pressure; Costa Rica and Poland’s verticality and low possession based on their resources; England’s goalscoring crisis in the last Nations League; France and Portugal’s set-piece power; and Germany’s now recognized ability to win back almost eight times per game in the last 40 meters of the pitch.
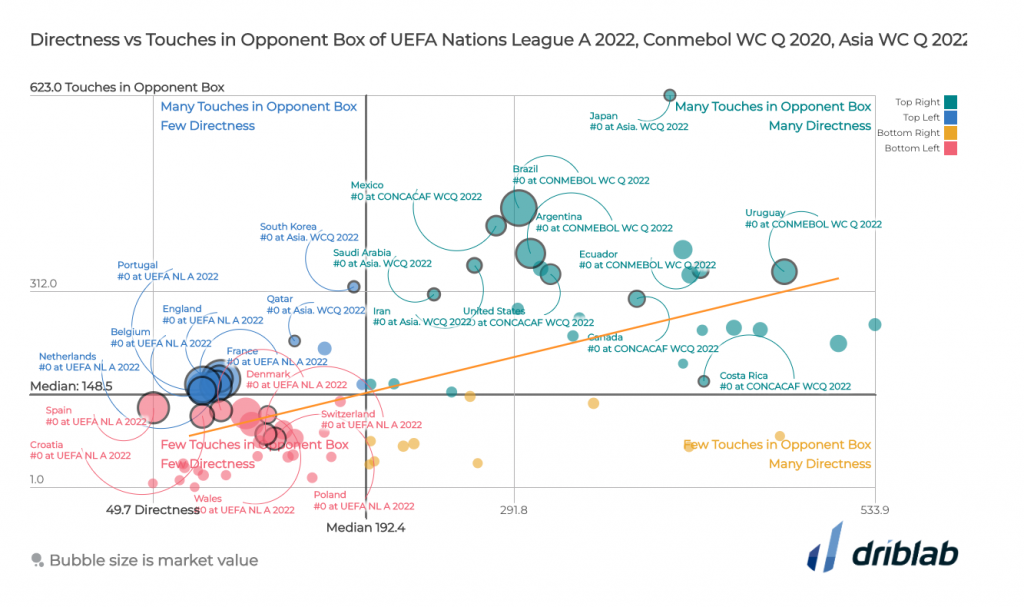
On the other hand, using scatter graphs we can find out how vertical each team is and whether their verticality or horizontality translates into arrivals to the box or a constant depth. With the ‘Verticality’ metric we measure how each team approaches the goal, which gives us a clear picture of how each of them behaves to reach the opponent’s goal. European teams are located in the lower left quadrant, accustomed to doing everything in a more organized and elaborate way, advancing with safe and short passes, while the Americans or Asians tend to be more direct and reactive.
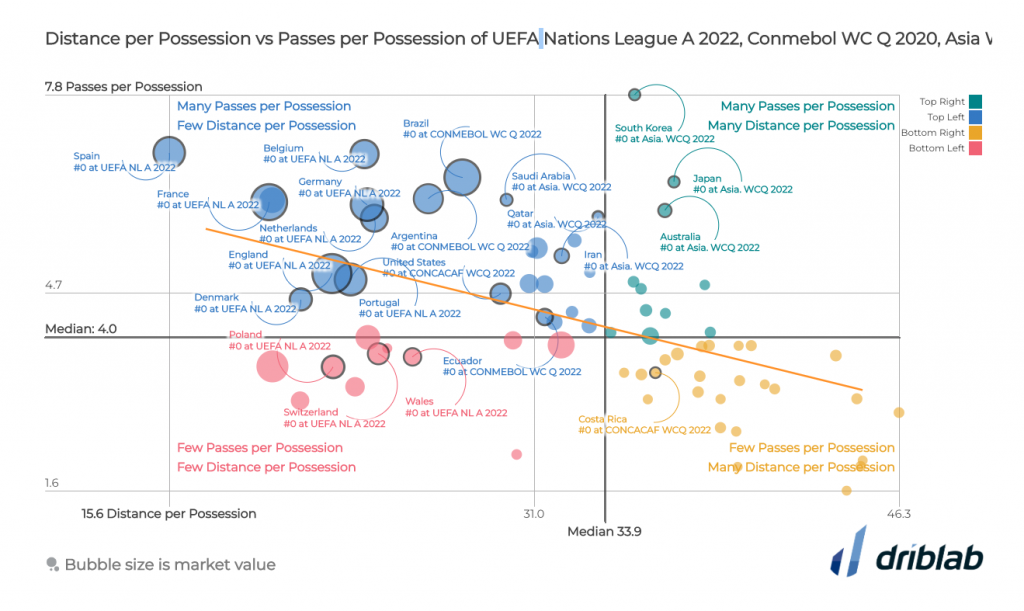
Another possibility to see how elaborate is the attack of each team is to cross the metrics passes per possession and distance (in meters) that each team travels in each possession. Many of these indicators show us traits of each team, what resources they have and how they got to Qatar.
We are Driblab, a consultancy specialized in the statistical analysis of players and teams; our work is focused on advising and minimizing risk in professional football decision-making in areas related to talent detection and footballer evaluations. Our database has more than 200,000 players from more than 180 competitions, covering information from all over the world. Here you can learn more about how we work and what we offer.


