
With the season already started in almost all European leagues, the coaching staff and performance analysis departments prepare each week the analysis of the next opponent, visualising several matches and filtering data such as those you can see in our driblabPRO platform. In this text we are going to offer some of the visualisations that are available to the scouting departments of our clients, with all the updated and automated information to see the evolution of the teams.
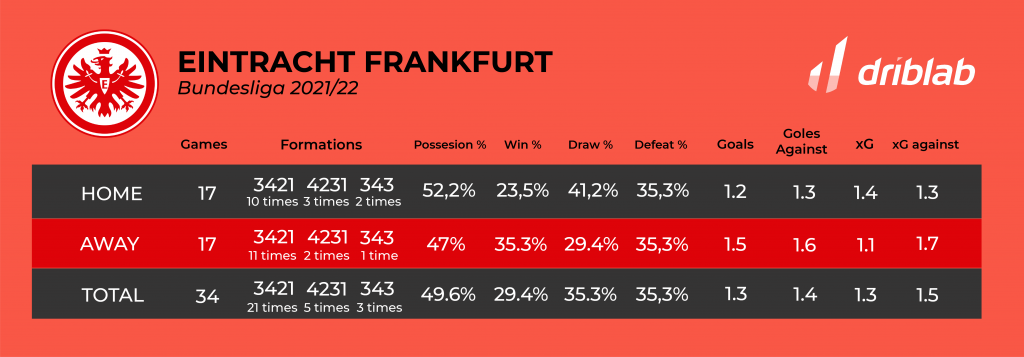
With Real Madrid – Eintracht Frankfurt in the European Super Cup as the most recent competition, we are going to use the Europa League champion as a reference as an opponent to analyse. A valuable piece of information to get a first insight into the team is to know their home and away performances, linking them with the formations they have used and what they generate both for and against.
**This is just a small part of the opponent analysis options that are stored in driblabPRO. Among many other sections, we find analysis of corner kicks, player performance or all substitutions made, separated by minutes and positions, and their impact on the matches.
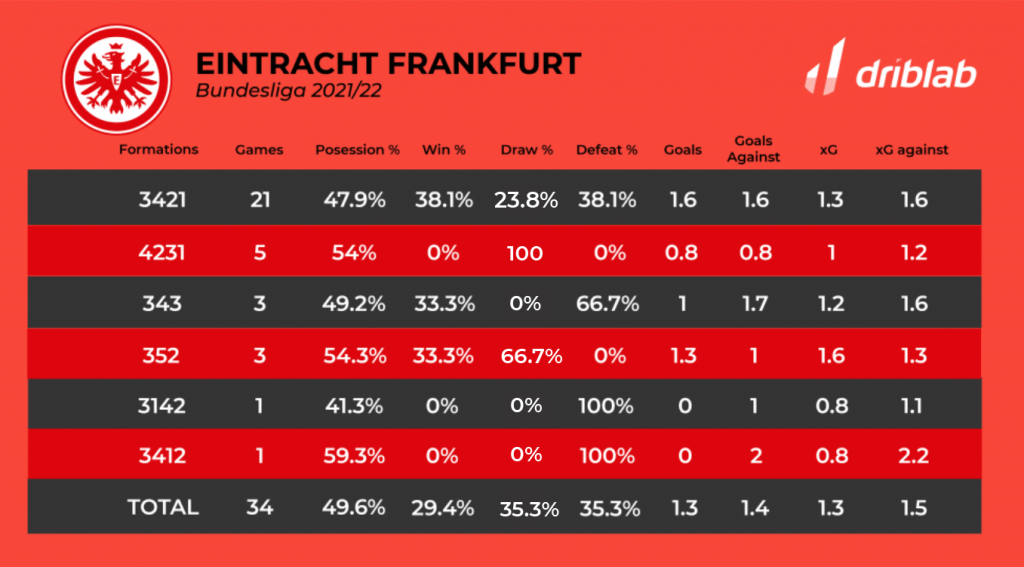
Although Eintracht Frankfurt has a basic formation (3421), in 13 matches last season they used a different one, and we can go deeper into their performance with each formation (up to six different ones in the 2021/22 season). For each formation we will be able to know their percentage of possession in the matches played, what they generated for and against and the results obtained with each formation.
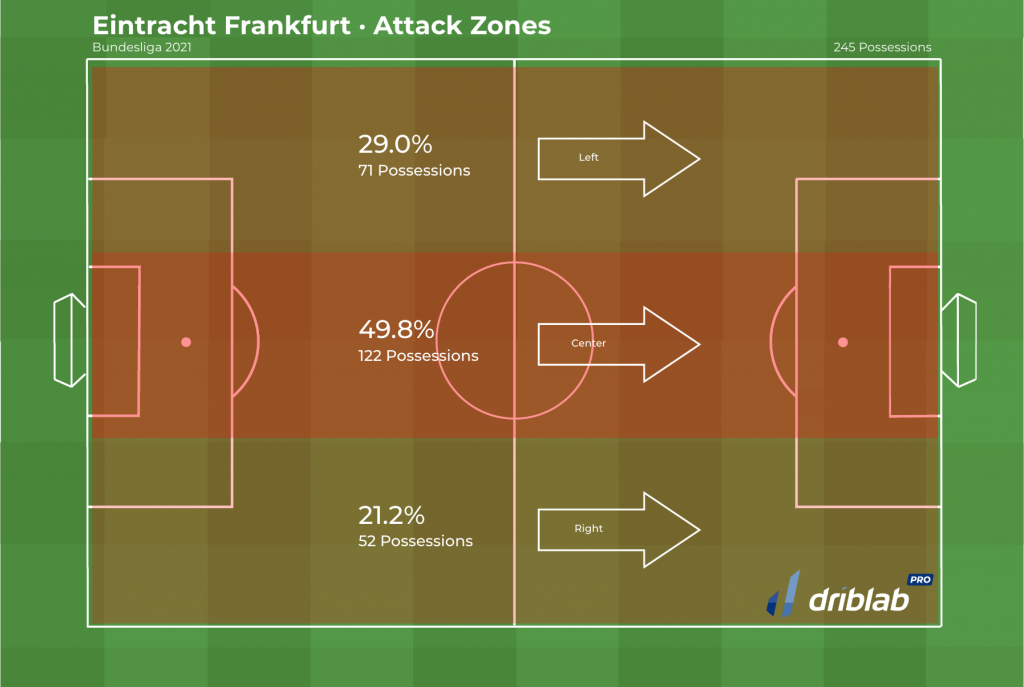
On a more tactical level, we can see where the team starts, progresses and finishes by dividing the pitch into three lanes. In the map below, from last season, we can see the importance of Serbian left back Filip Kostic in the attacks of Olivier Glassner’s side. This season, with Kostic leaving for Juventus, we will see how this visualisation changes. This map is separated into possessions started, possessions finished and whether they ended in a shot or only reached the box. Possessions where the ball was lost before reaching the box or ending in a shot are not taken into account.
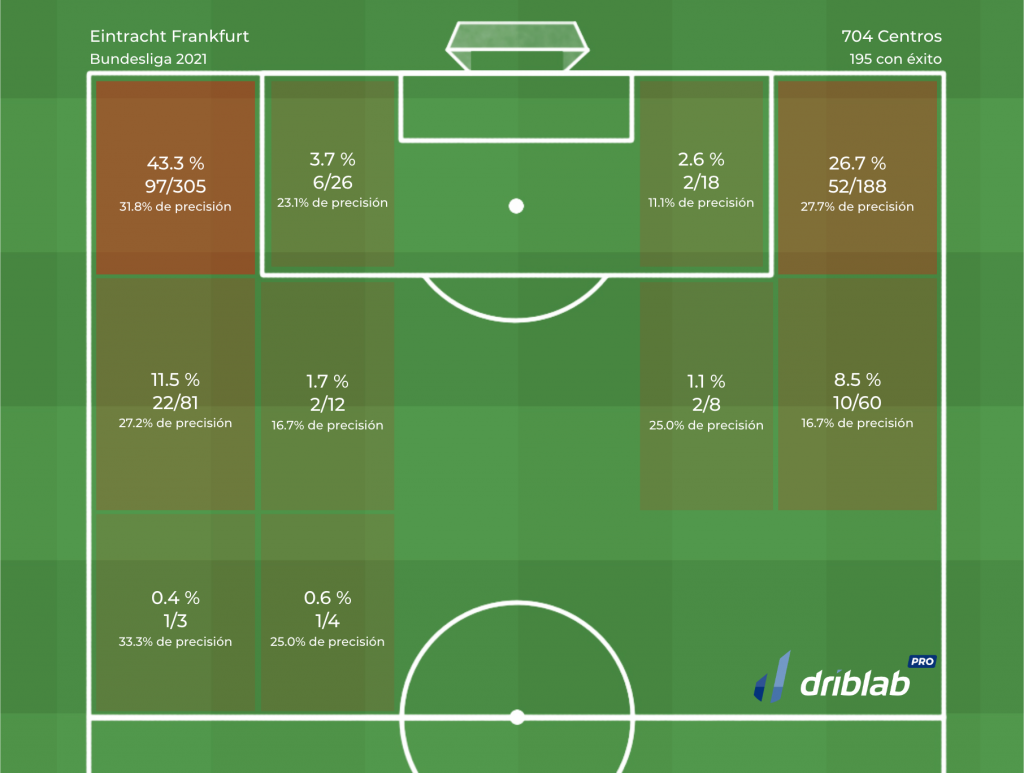
To be able to see the impact of the opponent’s outside play, we have a cross map, where we can see the importance of Filip Kostic in Eintracht’s attacking play, with more than 12% of crosses made from the left flank compared to the right flank, as well as the accuracy in completing those crosses (almost one out of three Eintracht crosses from the left flank find a finisher).
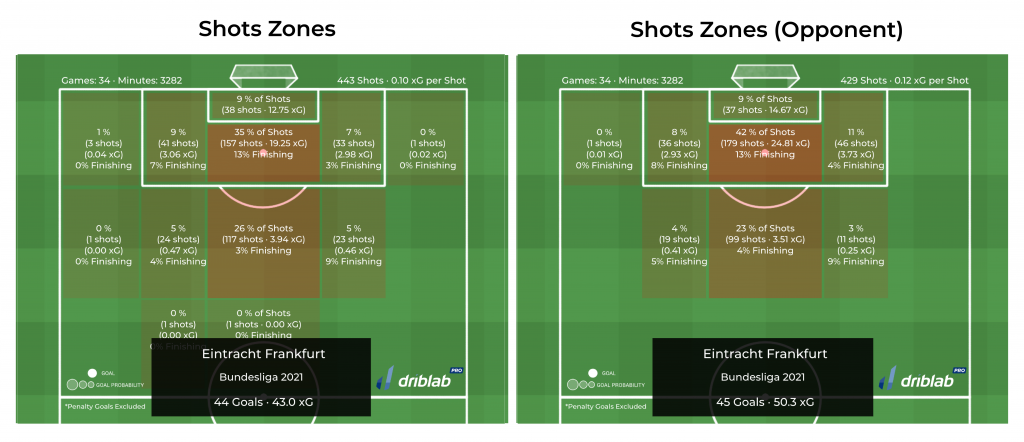
Knowing the shot map and the scoring effectiveness both for and against is another way to quickly find out what a team generates and what their opponents generate, for example, how many shots they concede in the penalty area and the average value of their chances (xG per shot).
We are Driblab, a consultancy specialized in the statistical analysis of players and teams; our work is focused on advising and minimizing risk in professional football decision-making in areas related to talent detection and footballer evaluations. Our database has more than 200,000 players from more than 180 competitions, covering information from all over the world. Here you can learn more about how we work and what we offer.


