
These are the improvements added to driblabPRO during the months of June, July and August.
PLAYER’S INJURIES
In each player’s page, we have added a new tab, ‘Injuries’, with information about the player’s injuries. It includes a list containing information about the season, type of injury, and dates and number of games lost; and a graphic to complement this information visually, grouping the injuries by part of the body and showing the number of days the player has lost because of injuries of each body part. The graph has a filter to select whether to show the injuries suffered during the last year or every injury recorded in Driblab’s database.
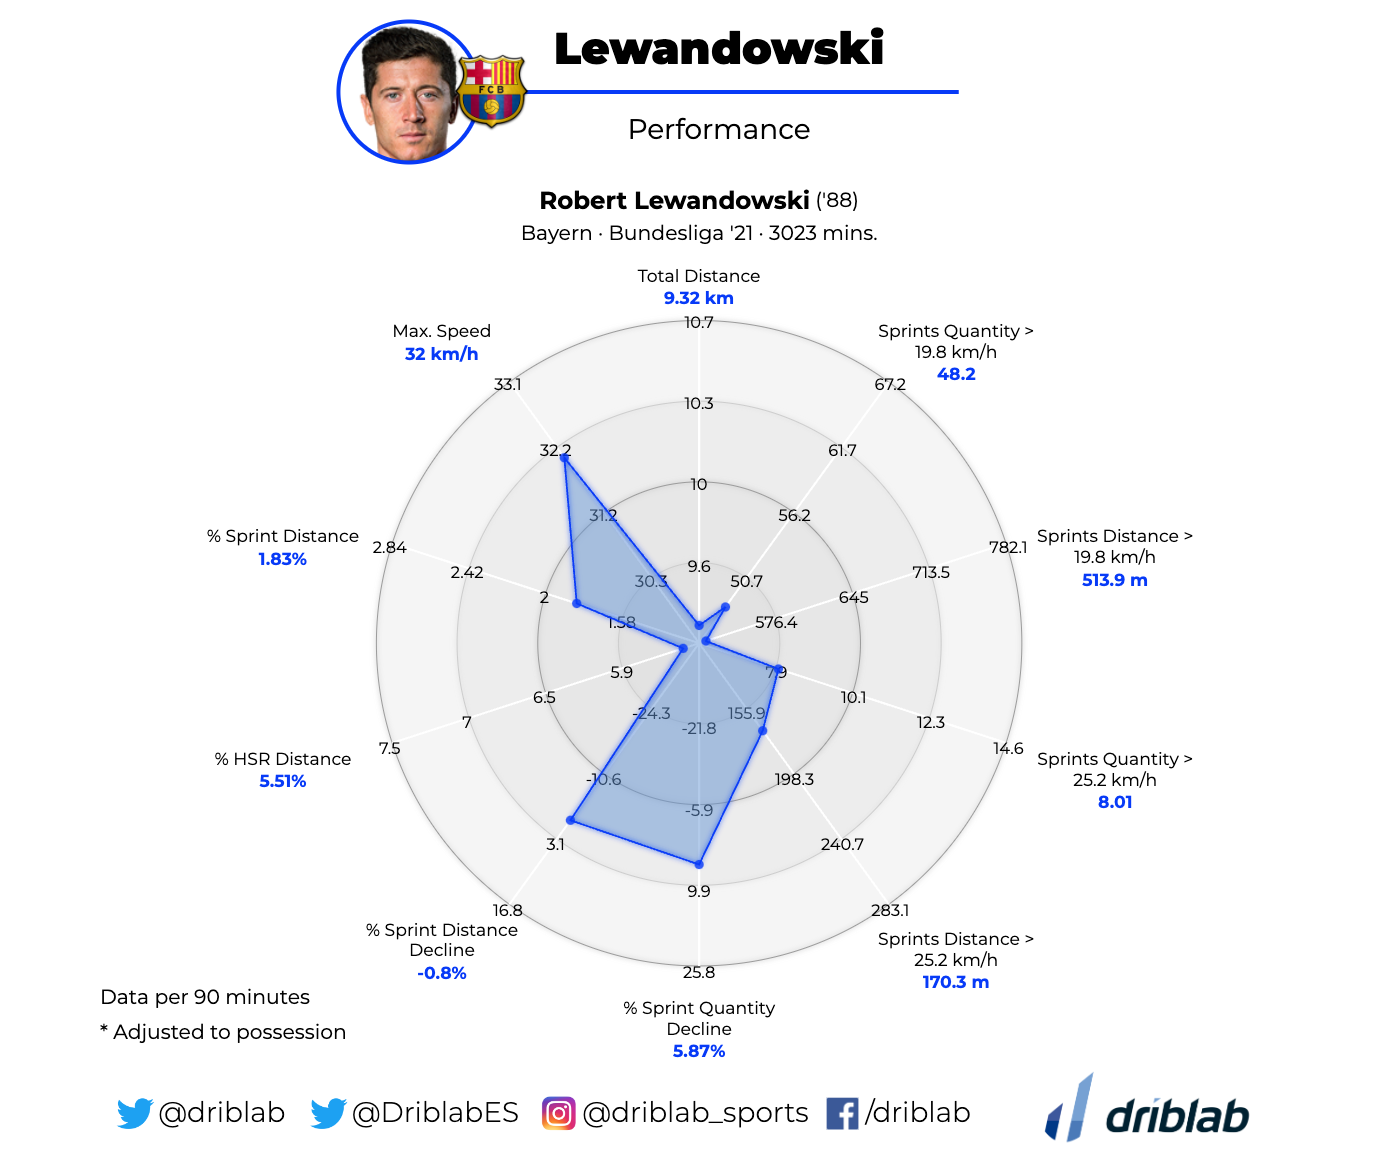
PHYSICAL RADARS
Thanks to the recent integration agreement signed with SkillCorner, those clients and users working both with Driblab and SkillCorner now have the possibility to create radars with the physical stats collected by the leading provider of broadcast tracking data to enhance analysis and scouting.
SIMILARITY
To facilitate the task of player hunting, we have developed a new tool under the ‘Players’ page: ‘Similarity’. It allows users to search for a player and it will look for players in the same position with comparable stats, showing a radar with the principal stats and also to which percentage both players are alike.
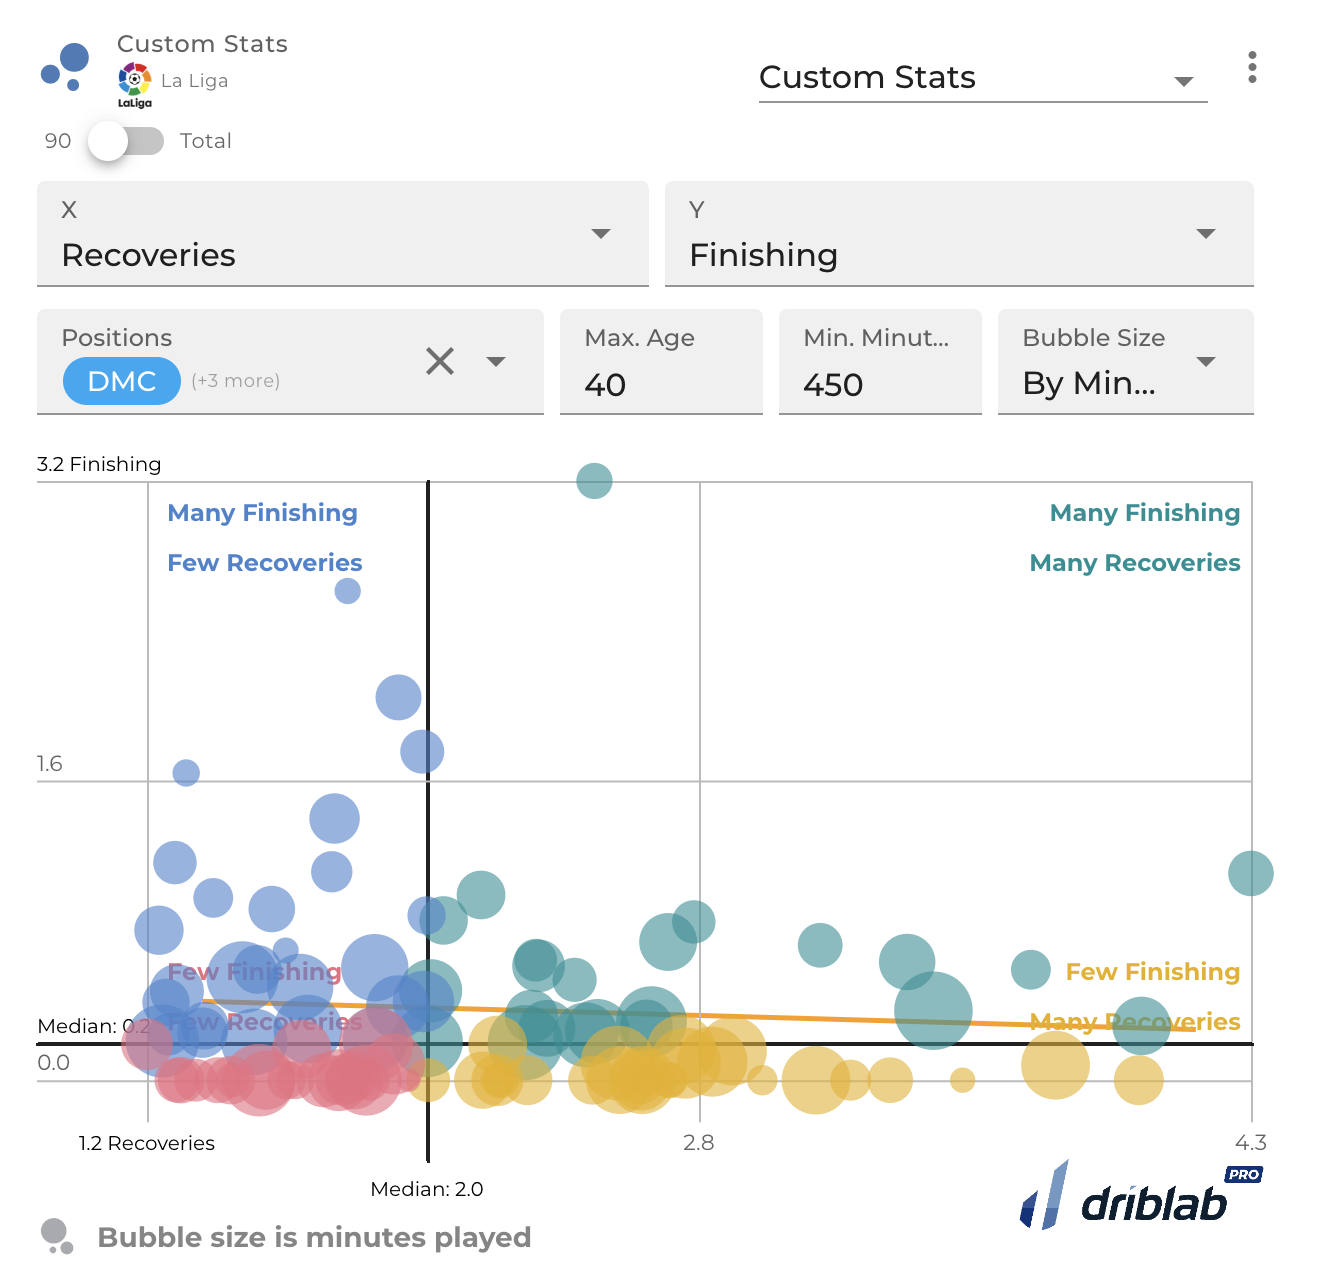
SCATTER PLOT PERSONALIZATION
Carrying on with our goal of easing our user experience, we have added the possibility of personalizing the axes in our scatterplots, giving room for unique comparisons within a single scatter plot.
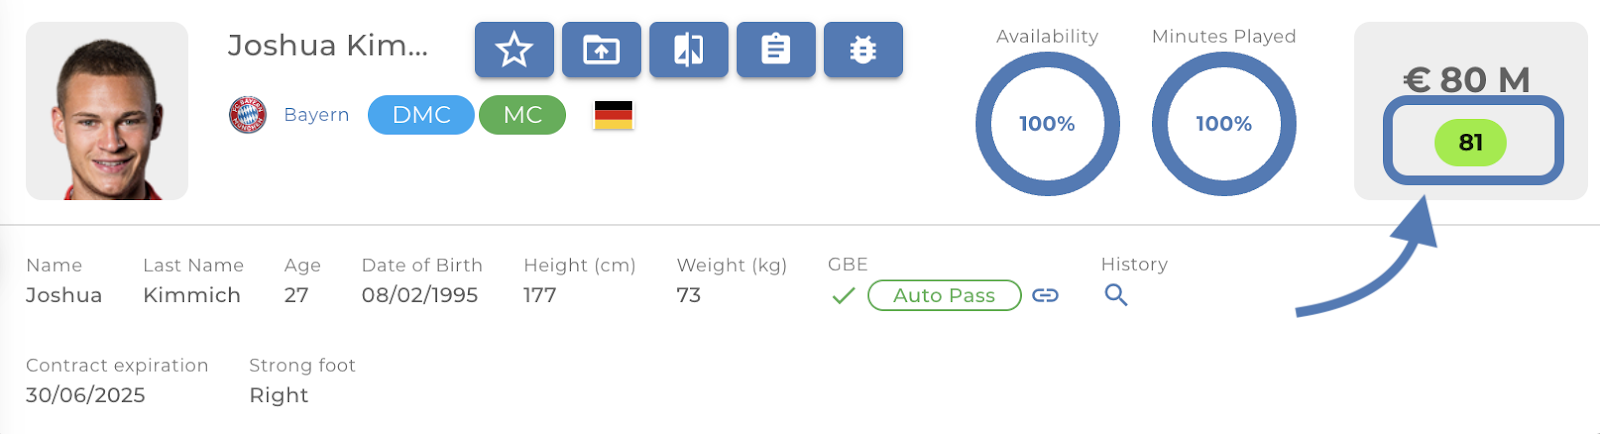
SCORE
In order to measure the performance of a player more directly, we have our own Score or Performance Index, with which we can evaluate players automatically and objectively, by considering their actions in a match and/or season. In this way, we assign a number between 0 and 100 as a sample of the player’s performance, as well as chromatic (green, orange, red) to have a first impact of their level and performance. Our clients can customise their Score to give more value to events and metrics that suit their needs.
NEW RADAR STATS
Our radar, the standard visualisation for measuring performance, consists of eleven metrics selected by position, but that’s just the beginning. As we have told you in the past, this radar is completely flexible and allows you to add or change more than 170 metrics, to which we have created and added the following:
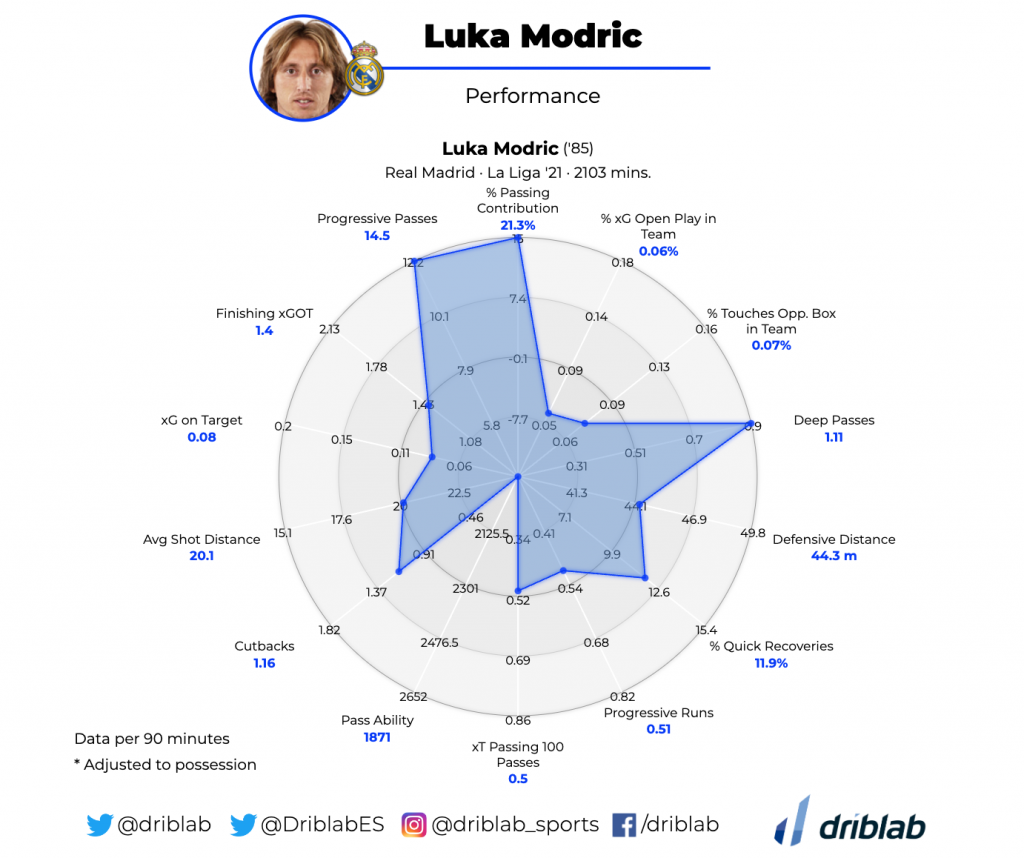
We have added:
- PassingContribution: “Percentage that measures the threat and added value of passes taking into account the position of the receiver”.
- xGOPInTeam: “Percentage of expected goals generated in open play of his team’s total”.
- TouchesOppBoxInTeam: “Percentage of touches of the ball in the opponent’s box out of his team’ total”.
- DeepPasses: “Passes from outside a 20-metre radius of the opponent’s goal that end up inside the goal”.
- ProgressiveRuns: “Carries that bring you closer to the opponent’s penalty area. It is considered progressive if the player goes 30 metres when starting and finishing in his own half; if he goes 15 metres starting in his own half and finishing in the opponent’s half, or if he goes 10 metres starting and finishing in the opponent’s half”.
- DefensiveDistance: “Average distance from own goal of defensive duels played”.
- QuickRecoveriesPct: “Percentage of quick recoveries between interceptions and attempted tackles”.
- xTPassing100Passes: “Expected threat generated from passes only and per 100 passes”.
- ProgressivePassesAccurate: “Passes completed 10 metres or more towards the opposition goal”
- PassAbility: “Ratio of completed passes to expected threat by passing (xP)”.
- Cutbacks: “Passes from baseline backwards and into the box”.
- AvgShotDistance: “Average distance of the total number of shots taken”.
- xGOnTarget: “Expected goals that end up between the posts. Unlike Expected Goals, this model measures the probability of a shot ending in a goal once the player has taken the shot and knowing where the shot landed in the goal. This model also measures the probability that the goalkeeper will save each shot on goal”.
- FinishingxGOT: “Percentage of shots on goal that result in a goal using the Expected Goals on Target model. This metric measures how much value the striker adds with the quality of his shots by measuring the percentage of goals converted in relation to his shots on goal”.
*Remember, you can create a new radar template in Settings > Templates > Radar Template


