‘Expected goals’ (xG) is a metric that analyses the quality of the chances that take place in a match. Each shot has a value that shows the probability of becoming a goal. This number is the percentage (0.1 means that this shot ends up in goal 10% of the time) that is assigned according to the place of the shot, the distance to the goal and the angle, as well as the part of the body (head, foot or others) with which the ball is shot, adding to the variable the speed of the play, the pass that precedes – if any – the shot, etc. To facilitate the understanding of the tool we are going to show examples of the model of goals expected from Driblab.
How the expected goals began to be used (xG)
This model was started in 2013 by our CEO Salvador Carmona. This metric responds to the need to quantify the value of scoring chances. There were already models that answered these questions but at Driblab we work with different parameters and it differs from the rest of the companies in the amounts of xG it gives to the shots. The first ones who created a model of xG were the bookmakers, soon after, were people who worked in clubs or pretended to do it, as well as statisticians who made their models for pure hobby. Step by step the xG models have made a space in the analysis with pages like FiveThirtyEight, even having a place in international media like ESPN, The Guardian or FourFourTwo reaching the coaching staffs even being publicly mentioned as the example of Frank Lampard this season.
Our models have maps that allow the visualization of this metric. In our case our CTO Coré Ramiro developed maps where the Driblab model is shown in images like the one we see below corresponding to the second leg of the Champions League between Liverpool and Atletico Madrid:
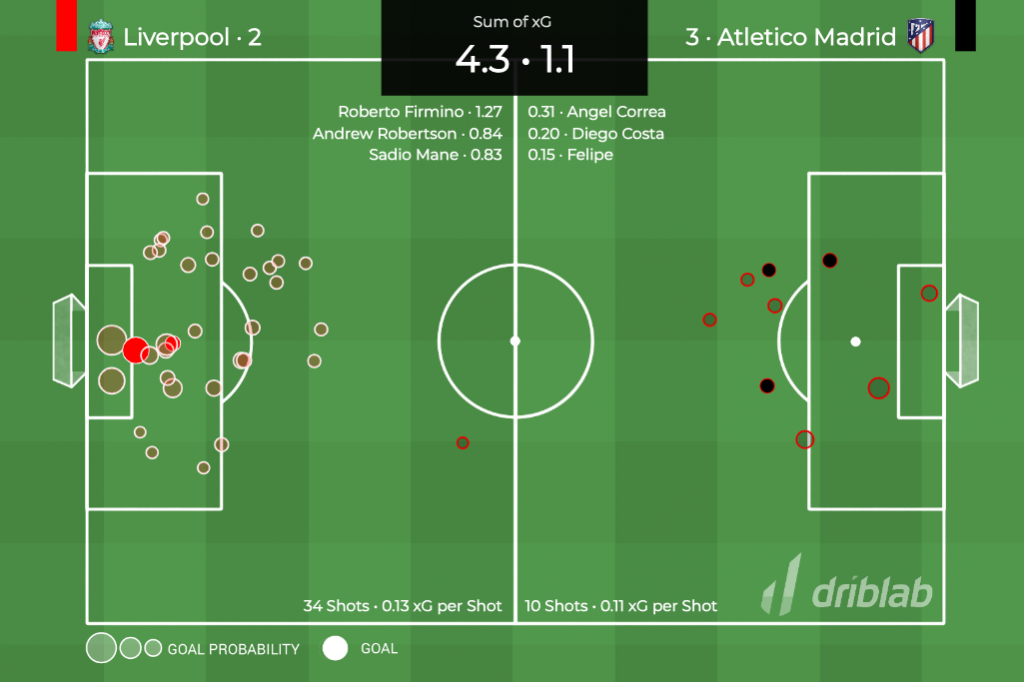
Each circle represents a chance, the size is the xG value (the probability of becoming a goal), and the filled circles are the goals. The sum of xG in the score above is a sum of each team’s total xG. In this case we see how Atletico were very effective with three goals on low-probability shots while Liverpool had low scoring efficiency part of blame to Jan Oblak’s great game saving more than expected.
Clarifications of our xG model
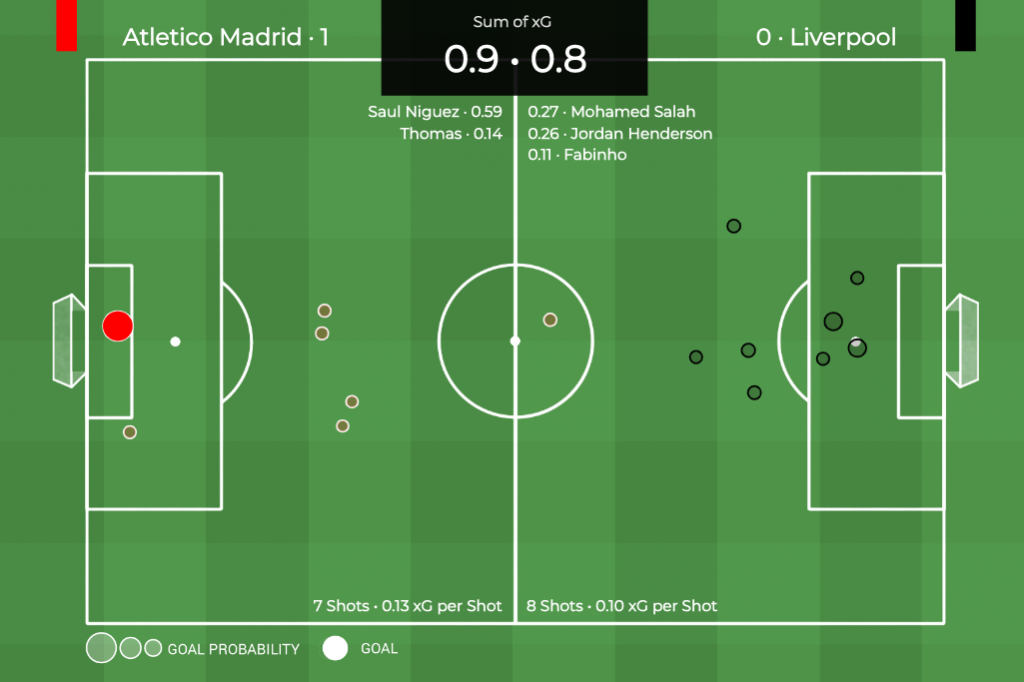
When evaluating the expected goals (xG) we calculate the quality of the chances. So a key indicator, beyond the total volume of xG in a match, is how clear those chances were. For example, in the first leg Atletico 1-0 Liverpool (image below) we see a very similar sum of xG for the two teams that tells us about an even match but if we analyze the quality of those shots Liverpool conceded in the goal a shot with 0.59 xG (1-0 Saul), that is, a shot that is a goal 59% of the times; while the most dangerous shot of Liverpool was 0.21 xG. Looking at the quality of the shots is a clear indicator beyond the total volume of goals expected.
xG applied to player analysis
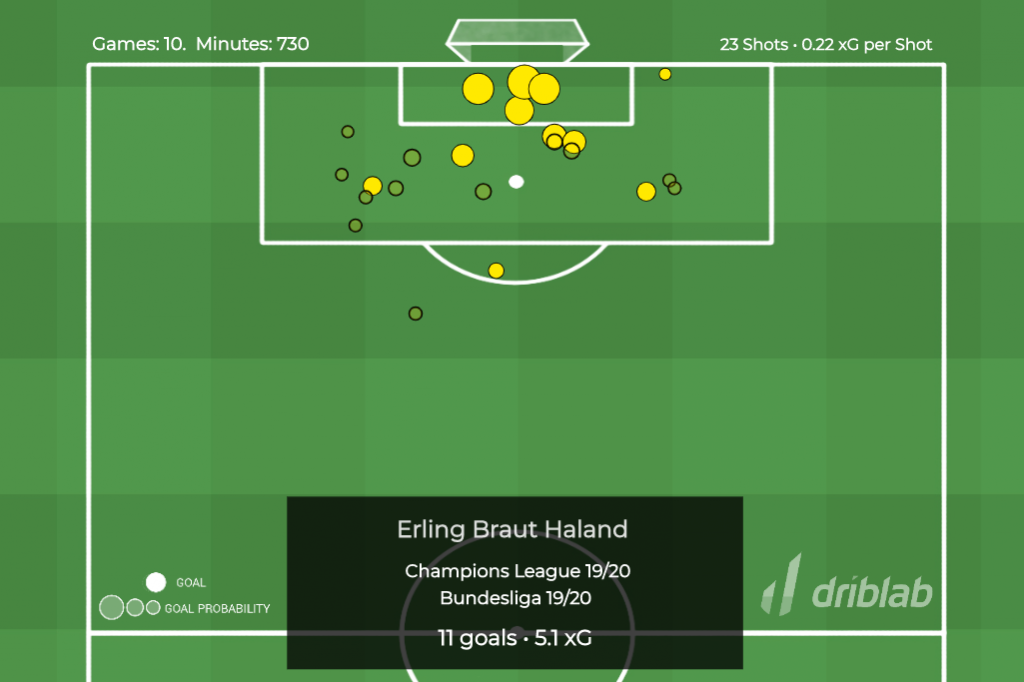
The value of the expected goals also allows for an analysis of a player’s effectiveness and ability to score. The use of this metric allows us to see the performance and evolution of the players at finishing and creating xG: the most relevant attacking players usually score more than expected. The example of Erling Haland is very enlightening as he stands out for his reliability in this regard: since he arrived at Borussia Dortmund he has scored more than twice as much as expected. In addition, another indicator that allows us to analyze the performance is the ‘xG per shot’ that shows us how efficient the selection of shots is: the higher xG per shot the less haste in those shots and the higher probability of scoring. In the case of Erling Haland we can see how this selection of shots with such a high xG per shot (0.22 xG per shot) is key to understanding why he is overperforming.
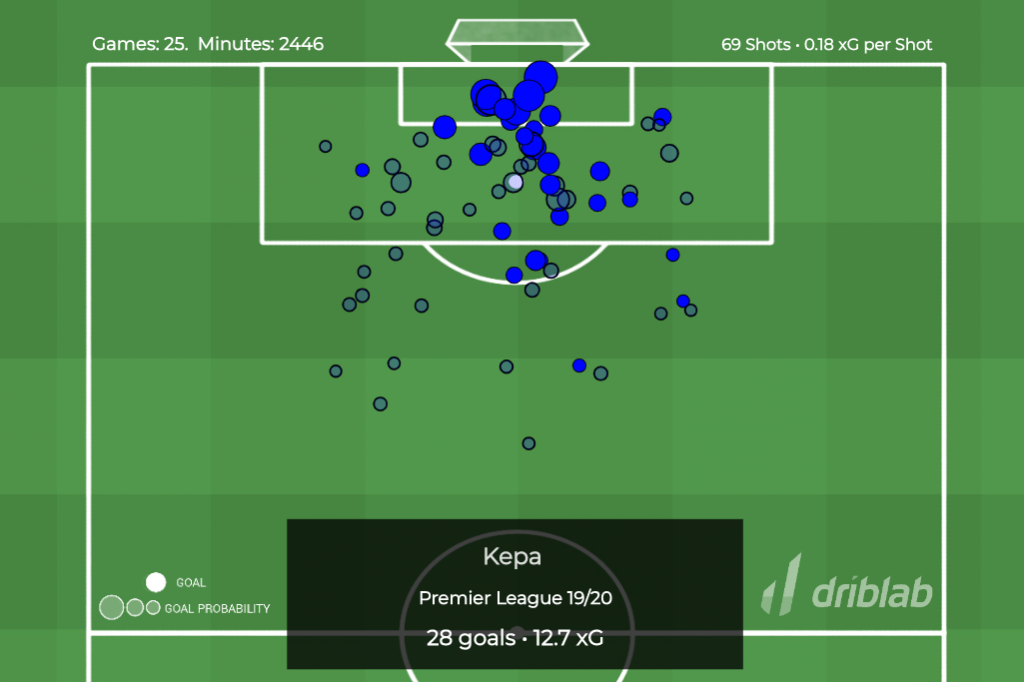
Similarly, the expected goals serve to compare the performance of defensive systems (how much they concede and the quality of the chances) and help to add context to goalkeeper performances. The example we will see below is very clear by analyzing the shots faced to goal (xG that a goalkeeper face) with the goals conceded. A clear example is Kepa Arrizabalaga, who this season is one of the worst goalkeepers in terms of expected goals. When evaluating this performance we must also consider the quality of the chances conceded (xG per shot) as well as the comparison between xG received and goals conceded. In this case we see how he is underperforming and that the opponents have found many shots in areas very close to the goal.
xG applied to team analysis
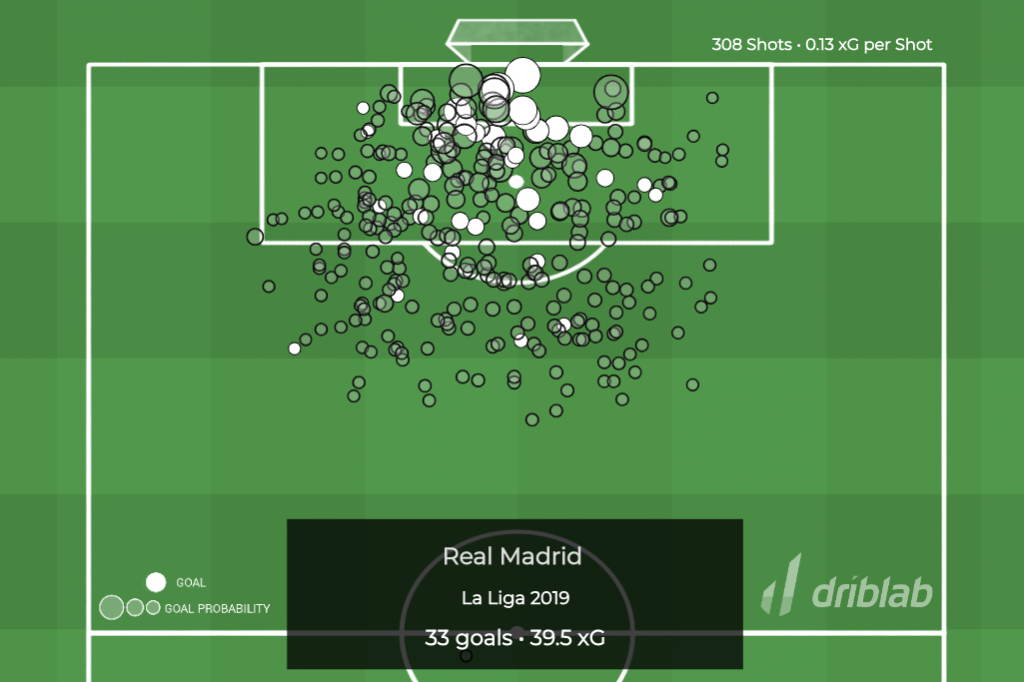
Another application that has the model of expected goals is its usefulness in measuring team performances. This analysis can differentiate the type of action with which these expected goals were created: open play, counter-attack, free kick, set piece or corner kick. For example, below we see the performance of Real Madrid in open play and the problems in finishing scoring fewer goals than expected this season. In this case, we are looking at a team that is scoring less than expected.
But how good is our Expected Goals (xG) model?
In this link you can learn more about our model and how we shape it to make it as accurate as possible.
We are Driblab, a consultancy specialized in the statistical analysis of players and teams; our work is focused on advising and minimizing risk in professional football decision-making in areas related to talent detection and footballer evaluations. Our database has more than 130,000 players from more than 120 competitions, covering information from all over the world. Here you can learn more about how we work and what we offer.


