
All models that rule the modern football analytics have something in common: goal scoring. The most basic, and more popular every day is expected goals (xG), which is the probability each shot has to end up in goal. All metrics derived from xG, such as expected assists, build up of xG or xG saved, are metrics where the only relevant information is whether there is a goal or not. Even more complex models like expected threat, measure threat as the probability of the attack to end up in a goal. And even though goals are the most important action in a football match, they are sporadic. Today, we aim to analyze the most repeated action in any match: passes.
The revolution of Passing Contribution with respect other pass models is that decision making is taken into account, and not just its completion ratio. This is, other models measure the probability that a certain pass is completed correctly, as a function of the position of start and end of the pass. This way, by giving 0.67 Passing Contribution value to a pass or 0.82 to another in the same way xG does, we can obtain the number of expected passes. Our model works differently. It does not assign a probability to each pass but instead, from the player’s point of view, it considers all possible passes and weighs factors such as risk, difficulty and benefit.
The algorithm provides us with two metrics: the average threat from the passes and how it compares with the average player, referred to as threat added. With our Passing Contribution metric we aim to measure and identify those players that not only pass the ball better than an average player, but also make better decisions at passing in terms of putting their team in a better situation to score a goal. This way, we remove from the equation those players that make the easy pass backwards in order to reward players that truly benefit their teams taking the risk with a relevant pass, as long as these passes are completed with success.
In the last La Liga edition, a total of 355.744 passes were attempted, and 272.809 were completed with success. However, just 942 goals were scored. This is almost 378 passes attempted per goal, which makes it impossible to assign each pass a goal-scoring value in a significant way. The expected threat model does it, but just a small fraction of passes have significant xT values. And there are multiple types of passes: the initial pass, an assist, a free kick taken, a throw-in pass etc. How can we assess and measure all these passes? We’ll use Óscar Mingueza and his Champions League debut as an example. Obviously, the objective of his passes is not precisely generating a shooting situation; Barcelona has its own Pedri to do that.
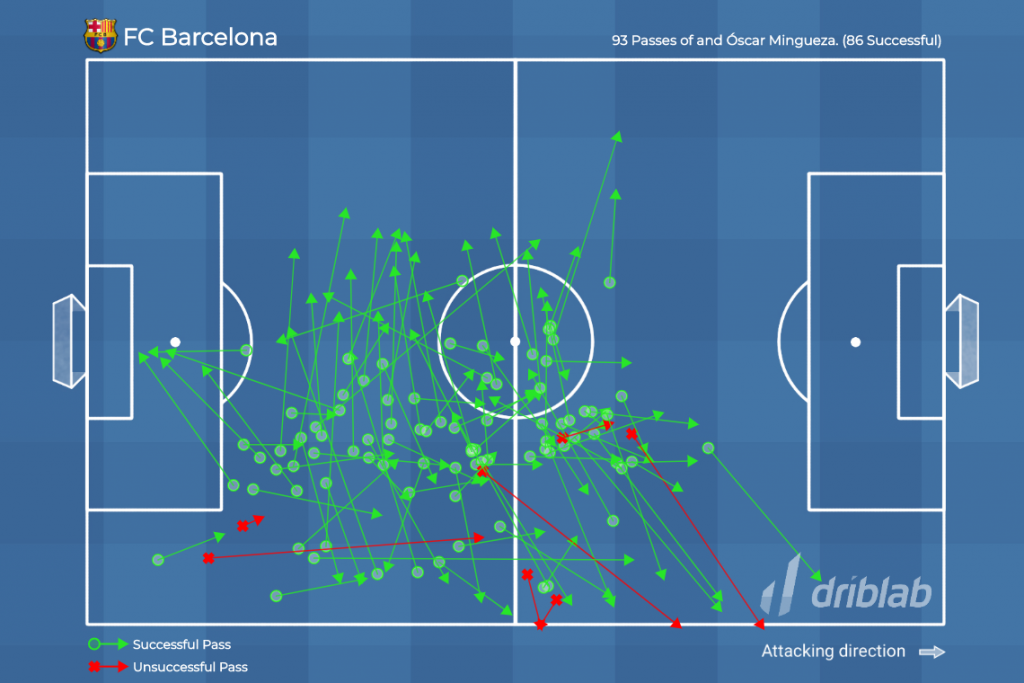
This is Mingueza’s pass map in the match against Dynamo Kyiv in November. Our goal is to assess his passing skills during the game. Right now, the models can tell you that he has successfully completed 86 passes out of the 93 he attempted, which represents a 92% of success rate. We can also know the number of passes he completed towards the opponent’s half, or the final third of the field. We could even find the expected threat (xT) he generated or the expected assists he gave. But all these metrics are missing something. How does this 92% compare with Dest’s 88% or Trincao success of 77%? Most likely, Mingueza’s passes were easier, thus displaying higher accuracy. Who played better? Who outperformed the average player the most?
The algorithm, as we said, measures the threat of a pass. It depends, ultimately, on the position where the ball is received. This means, if Mingueza gives a pass to Braithwaite, the threat increases as the danish forward is closer to Dynamo’s goal. But if he misses, the pass is more dangerous, as the unsuccessful pass lands closer to Ter Stegen. And how do we measure the threat added? It’s a matter of comparing the threat a pass has, versus the average threat all passes taken from a similar position have had.

Let’s go back to Kiev. Minute 51:34. Mingueza controls the ball at the centre of the field. He could attempt a long pass into the opponent box so Braithwaite tries to score, but this would probably be easy for the goalkeeper. He could play a simple pass to Lenglet: no difficulty, but a lot of risk if the pass is mistaken. He plays with Dest instead. The American will end up scoring a goal in that same action. Some models would award Mingueza with a pre-pre-pre-assist, or that he has built up 0.17 xG, or even that he generated 0.01 xT with that pass. Passing Contribution tells us, simultaneously, the threat of the pass and how it compares with what can be expected from a pass on that position.
These are a set of passes given by Antoine Griezmann against Athletic Bilbao. Let’s analyze them to see how they would fare in our new Passing Contribution metric:
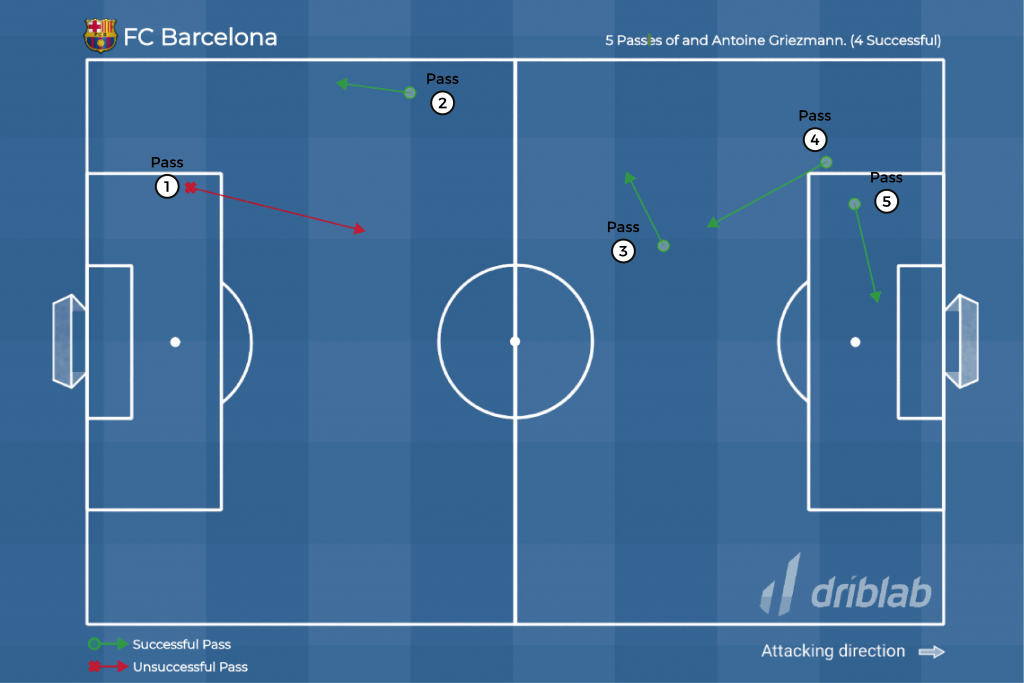
Pass 1: Missing Pass from own box
Completion ratio: HIGH
Threat in case of miss: VERY HIGH
Threat in case of hit: LOW
Pass outcome: FAIL
Passing Contribution: Highly negative
Pass 2: Pass backwards from own half
Completion ratio: HIGH
Threat in case of miss: HIGH
Threat in case of hit: LOW
Pass outcome: SUCCESS
Passing Contribution: Slightly Positive
Pass 3: Pass backwards from opponent half
Completion ratio: MEDIUM
Threat in case of miss: HIGH
Threat in case of hit: LOW
Pass outcome: SUCCESS
Passing Contribution: Slightly Positive
Pass 4: Pass backwards from opponent half (next to opponent box)
Completion ratio: LOW
Threat in case of miss: MEDIUM
Threat in case of hit: MEDIUM
Pass outcome: SUCCESS
Passing Contribution: Positive
Pass 5: Pass forward from opponent box
Completion ratio: LOW
Threat in case of miss: LOW
Threat in case of hit: HIGH
Pass outcome: SUCCESS
Passing Contribution: Highly Positive
Summing up, the new algorithm we present at Driblab, a consultancy specialized in data and statistical analysis of players and teams, is an innovative way of analyzing passes, which shows two dimensions from each pass: the value or threat of it and the threat that a certain player adds to the game. In a few weeks, we will take a look to the results this new metric gives us.
Our database has more than 180,000 players from more than 180 competitions, covering information from all over the world. Here you can learn more about how we work and what we offer.


