
Although it is the most widely used and representative, Expected Goals (xG) is not the only metric that advanced statistics has to measure the probability of a game action being more or less successful. Along with xG, at Driblab we measure different types of attacking generation, such as Expected Threat (xT), which we have already discussed on several occasions, or Expected Assists (xA), which we are going to focus on in this text.
With this metric, the Expected Assists (xA), we seek to measure the quality of a pass that ends in a shot. If an assist is only counted when the shot ends in a goal, with the xA we seek to parameterize and measure the value of a pass that ends in a shot and its probability of becoming a real assist that ends in a goal. To summarise in a sentence, expected assists measure the danger created by a pass that ends up in a shot, assigning it a probability related to the chances of scoring a goal.
That said, whether the play ends in a goal and therefore in an assist depends exclusively on the finisher, which shows that in order to analyse expected assists, having better or worse finishers nearby is crucial. Therefore, in addition to xG, xA is also useful to know how good the finishers of a particular team are over a period of time (a season or a competition). The xA measures the quality of the pass taking into account the quality of the finisher, as we will see later with an individual and more concrete case.
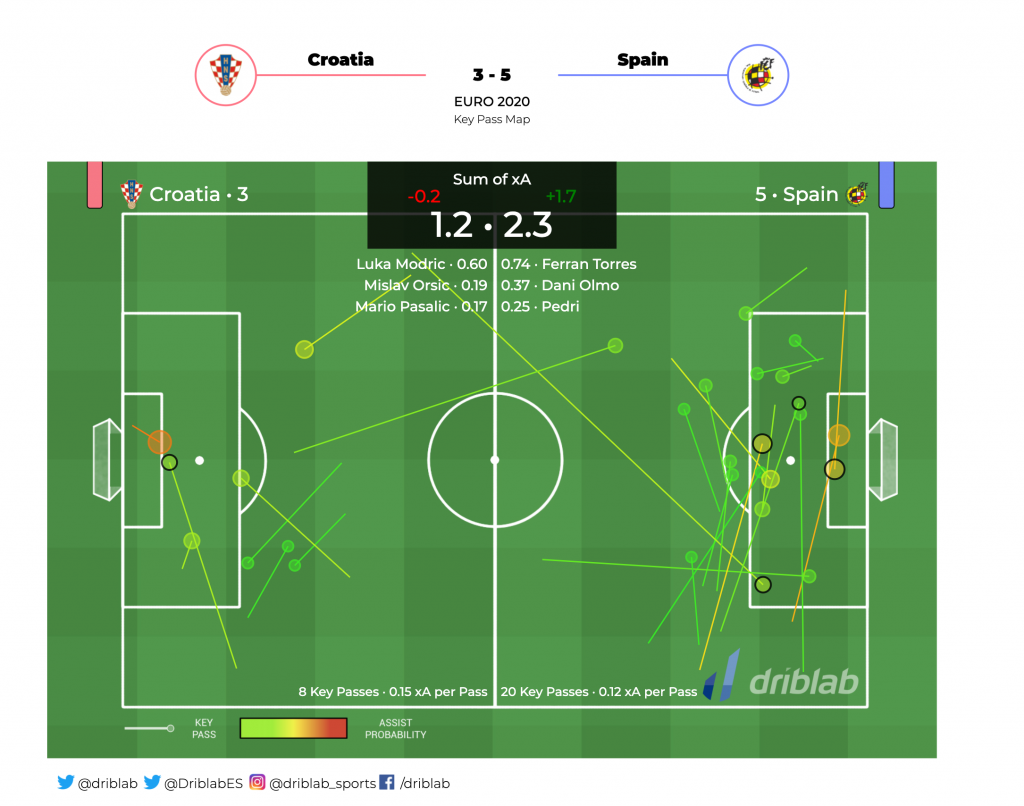
In our visualisation, each circle represents a pass that results in a shot, the size is the value of xA (the probability of a pass becoming a shot that results in a goal), and the filled circles are goals. The sum of xA in the scoreboard above is a sum of the total xA for each team. In the xA map of the Croatia vs Spain Euro2020, our infographic differentiates the assist probability by the colour and size of the circle where the teammate scores.
xA applied to player analysis
As mentioned in the introduction, unlike xG, the xA metric is also measured by taking into account the quality of another teammate and not just the passer. A good way to measure whether a player has the capacity and ability to generate expected assists is to see how likely it is that his passes are converted into assists and which of them ended in a goal by looking at the context around him. It is possible that a player is generating more expected assists but his attacking teammates are missing those chances, and this is reflected in the individual expected assists metrics. This is the case for Neymar in the 2020/21 season: 5 assists and 6.1 expected assists. This situation can occur in reverse: that a player is providing more assists, thanks to very effective teammates in finishing, than he is producing due to the quality of his passes.
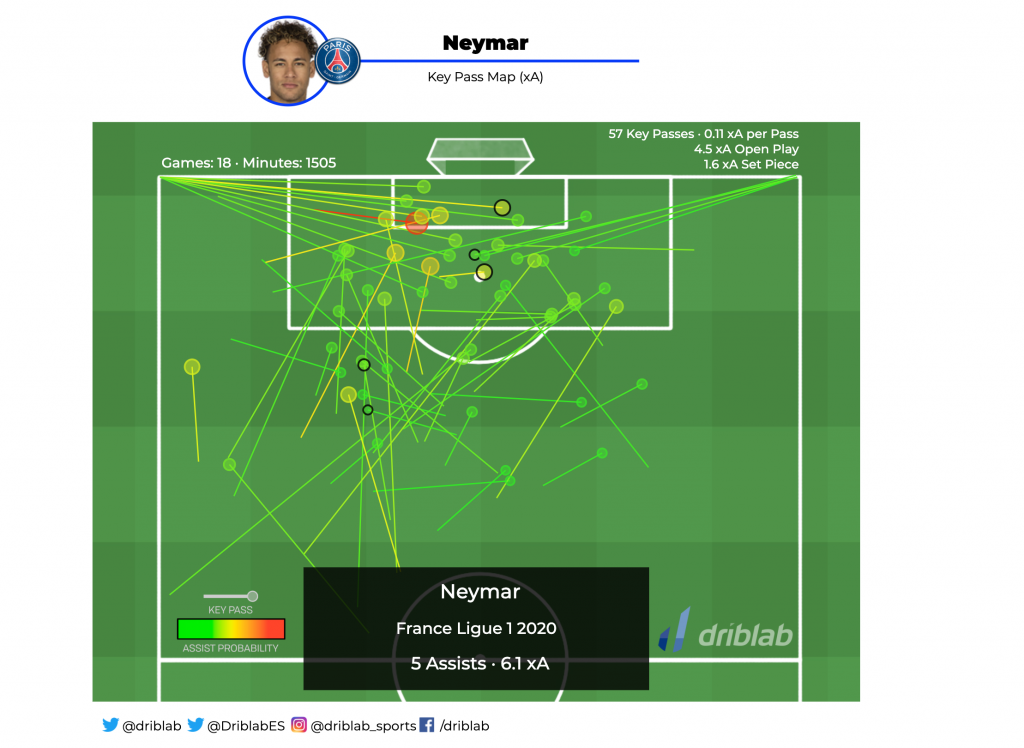
If you look at the top of the graph, you can read the number of expected assists generated by each pass that results in a shot, also called a ‘key pass’. The value 0.1 indicates that this assist ends in a goal 10% of the time. In terms of individual analysis, Neymar generates 0.11 xA for each pass that results in a finish.
In turn, our metrics and visualisations separate everything generated in play from everything generated from set pieces, thus being able to assess the players who generate the most expected assists with the ball in play from those who are able to be more productive from free kicks or corners, as we will see below.
xA applied to team analysis
These measurements are also used on a collective level, as is the case with xG. With the xA map of an entire season, we can check two things. On the one hand, the ability of a team to generate expected assists, which is also a measure of the danger it generates, as well as how many of those expected assists have been achieved by the goal scorers. A very obvious case of lack of effectiveness has been Getafe, having generated 21 expected assists and producing only 14.
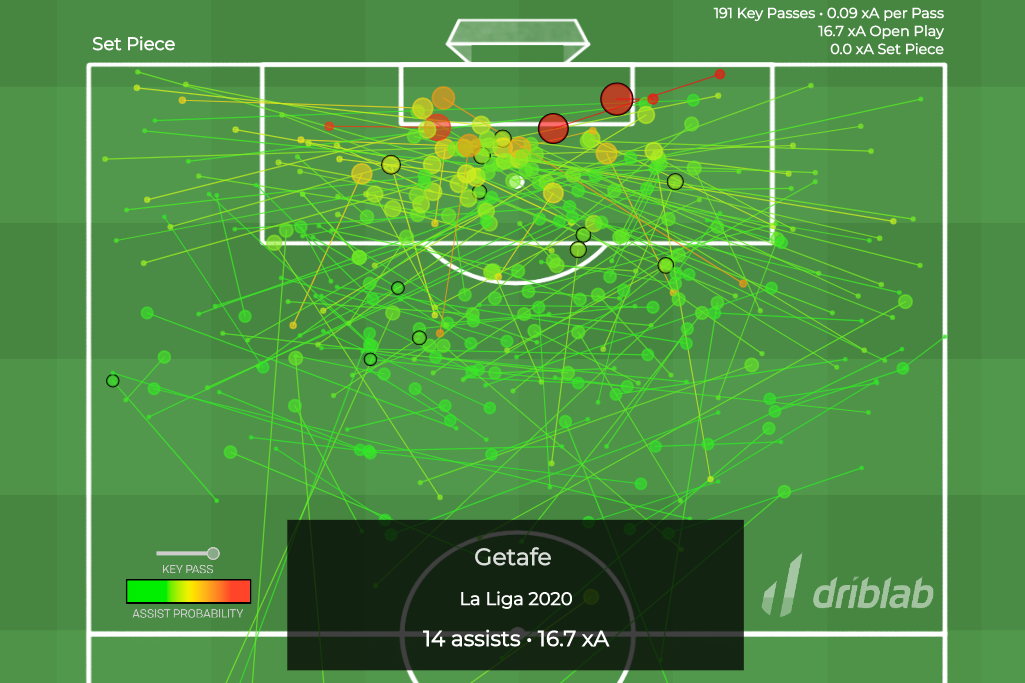
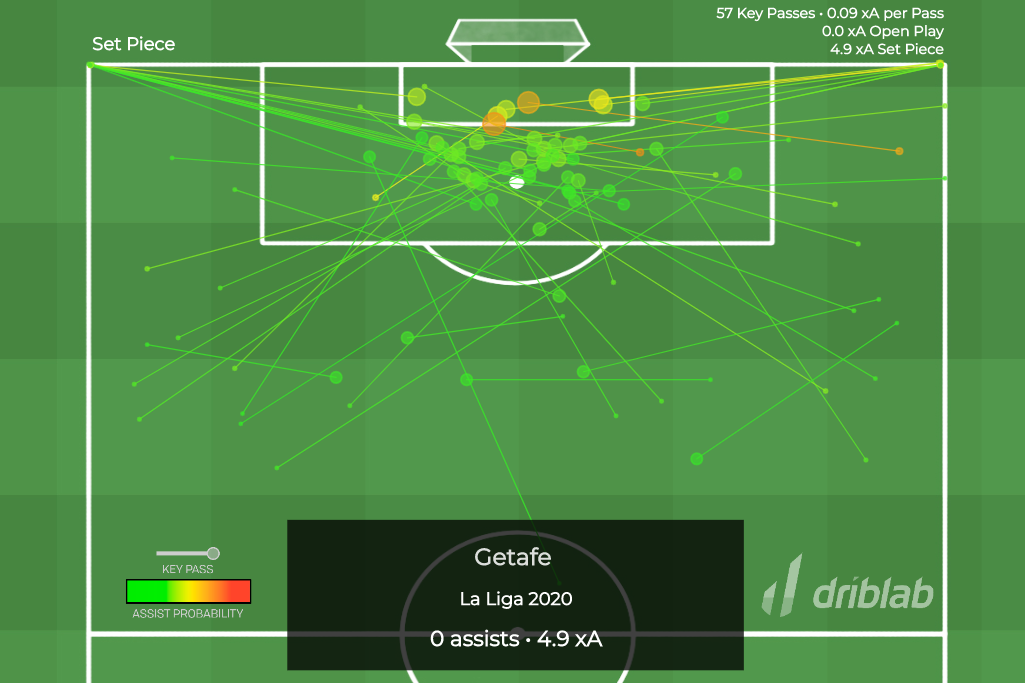
Our visualisations can differentiate all the expected assists produced in play from those made at set pieces – top left corner of the graph -. In this sense, the case of Getafe tells us that in set pieces they continue to have problems when it comes to materialising the quality of their passes that can end in goals after finishing, but it is at set pieces where their effectiveness is particularly low for what they produce, making it easier for us to analyse: Getafe generate and assist more and better than what they translate into goals. Their assistants have performed better than their finishers.
We are Driblab, a consultancy specialized in the statistical analysis of players and teams; our work is focused on advising and minimizing risk in professional football decision-making in areas related to talent detection and footballer evaluations. Our database has more than 180,000 players from more than 180 competitions, covering information from all over the world. Here you can learn more about how we work and what we offer.


