
Advanced statistics in the world of football has, among other things, one primary objective: to measure performance. We can model this concept and dress it up in other ways, but both the raw data and the refined metrics will always end up being oriented towards the performance of a player or a team. On that path that emerges between the dynamics of the game and the attempt to measure it, there is a whole world of possibilities, including that of the goalkeeper, the anti-hero who tries to avoid the genesis and ecstasy of football: the goal.
If a few weeks ago we measured Claim Accuracy there is something much more important and ahead of it: trying to avoid a goal. If the metric par excellence in offensive situations is that of Expected Goals (xG), its inverse is the so-called xGOT (Expected Goals On Target), which is nothing more than the ratio between the expected goals on target conceded by a goalkeeper – by extension his team – and the goals he finally conceded, establishing a direct impact whose difference reflects whether the goalkeeper prevented more or fewer goals than expected.
How are Expected Goals On Goal (xGOT) measured?
First of all, we must start from the most obvious: to shape this metric only shots on goal will be taken into account and, as with Expected Goals (xG), the value 0 will correspond to those shots that have no chance of ending in a goal and 1 to those that are always expected to be scored. From this basic premise, we can establish that the expected goals on target (xGOT) measures the probability of a goalkeeper conceding a goal by combining the goal probability of the shot (xG) with the place in the goal where the ball would go in. The better the quality of the shot and the tighter the location to the corners, the higher the value in xGOT that a goalkeeper will have to avoid.
While this metric can measure the quality with which a striker places his shots away from the goalkeeper, the most direct and valuable utility relates to goalkeepers, as to measure a goalkeeper’s performance against opponent’s shots it would be sufficient to look at the difference between goals conceded and expected goals on target to know how many goals a goalkeeper is preventing. We can therefore conclude that xG is a pre-shooting model and xGOT is a post-shooting model.

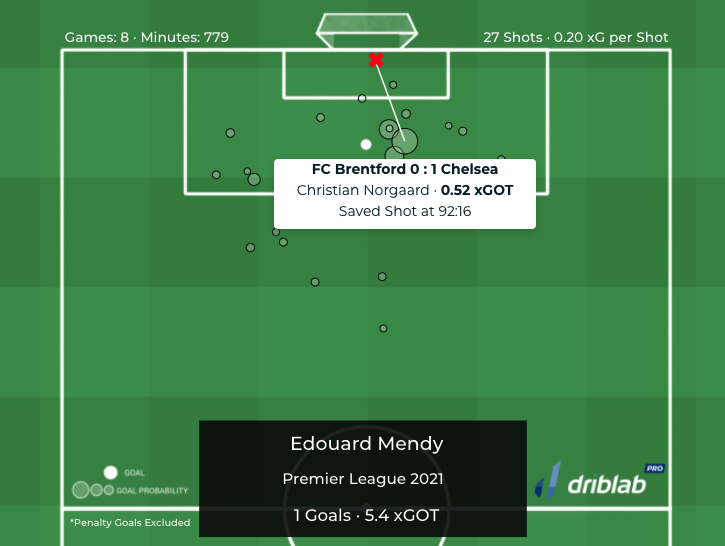
On this occasion in the video above, arising from Brentford 0 – 1 Chelsea in October 2021, Norgaard’s well-directed bicycle kick, Edouard Mendy showed his skills to deflect the shot, which had an xG of 0.20 according to our models, its equivalent being 0.52 xGOT. Mendy therefore prevented a goal that is scored 52% of the time.
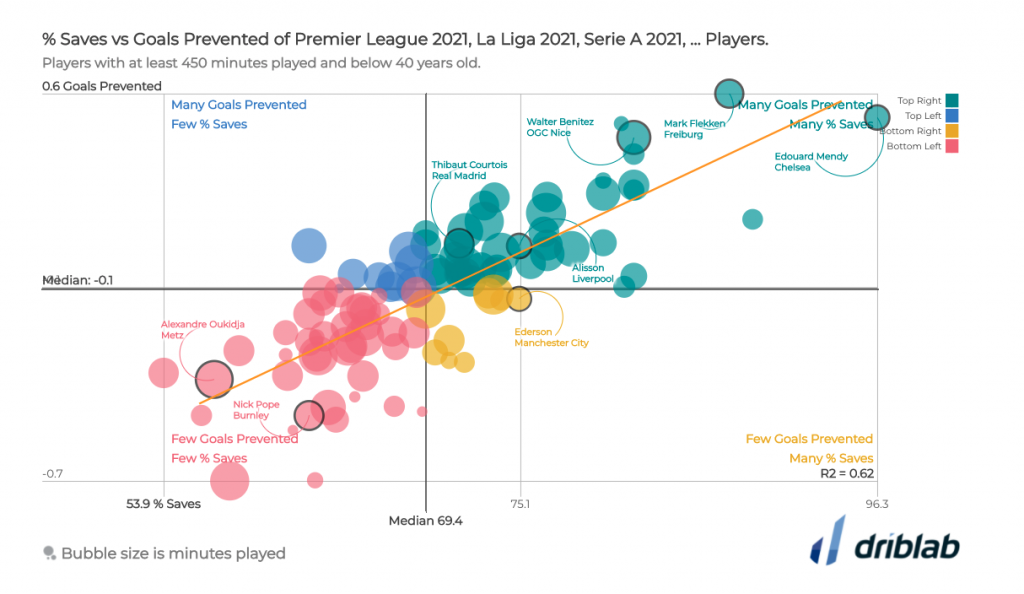
Using our Scatter Plot visualisation we will assess how the goalkeepers of the top five European leagues and the goalkeepers of Primera Argentina and Brasileirao are preventing goals in their respective current seasons. On the map above we can already see the incredible performance of Edouard Mendy (one goal conceded, more than five expected goals on target, i.e. five goals he should have conceded). Mark Flekken at surprising Freiburg or Walter Benitez at Nice are other goalkeepers who are saving several goals for their team.
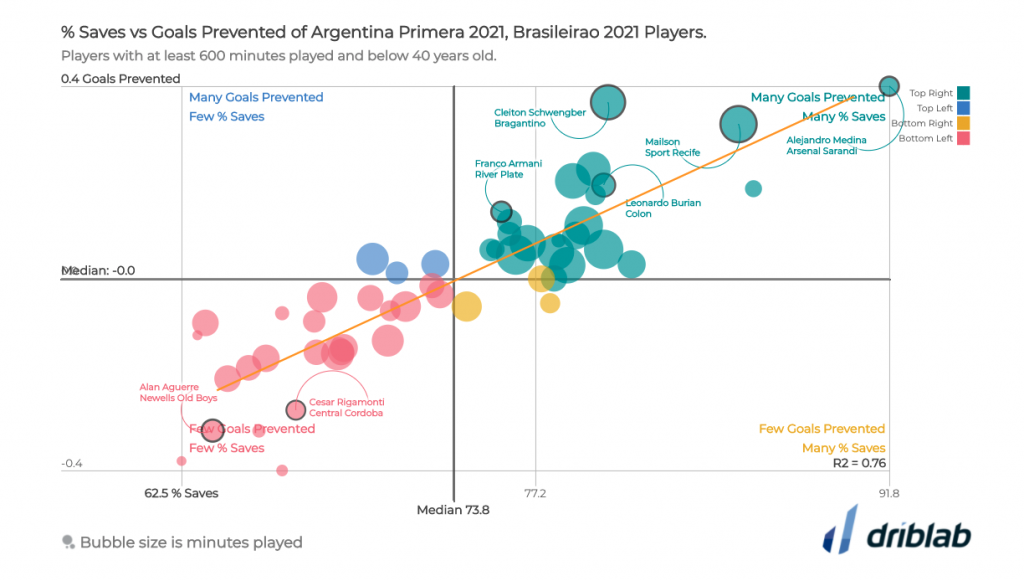
For the Argentinian and Brazilian leagues, our data shows that Alejandro Medina, Mailson and Cleiton Schwengber are the three goalkeepers who make the most saves and prevent the most goals with their saves based on the xGOT model. All this data is measured per 90 minutes of play and with at least 600 minutes played.
We are Driblab, a consultancy specialized in football analytics and big data; our work is focused on advising and minimizing risk in professional football decision-making in areas related to talent detection and footballer evaluations. Our database has more than 180,000 players from more than 180 competitions, covering information from all over the world. Here you can learn more about how we work and what we offer.


