xG Chain: the most important thing is to participate

Category: Player Analysis

How can we know if a player has influence on all possessions that end in a shot? We take a closer look at 'xG Chain'.

Published:12/01/2022

In its desire to measure a game as random as football, advanced statistics tries to be as deep as possible in all the game situations we can imagine. The spirit of many of the metrics created for this purpose is based on giving value to those players who are part of something much bigger, such as the creation of a goal scoring chance. This is the case of the Expected Goals Chain (xG Chain).

This metric is defined by the number of Expected Goals in which a player has participated; if the player has participated in a play that ends in a shot, the xG of the play will be added to this metric. In this way, we give value to players who are often part of passing sequences that end in a shot. In a specific play we might think that his importance is far from what happens later if his action is a five-metre horizontal pass, but when we extend these actions over time, in the long term, if the player is involved in numerous actions that end in a shot, his relevance within the team will be justified and well valued by the metric in question.

If the player is an attacker who is involved in many moves, he will have a lot of xG Chain, hence it is one of the metrics included in the striker radar, but this reaches an extra value for wingers or attacking midfielders with an incidence in the construction of moves ending in a shot. A good way to summarise this metric is to define it as the possessions that end in a shot that pass through the boots of the player in question, whether the possession is four passes or more than 20.

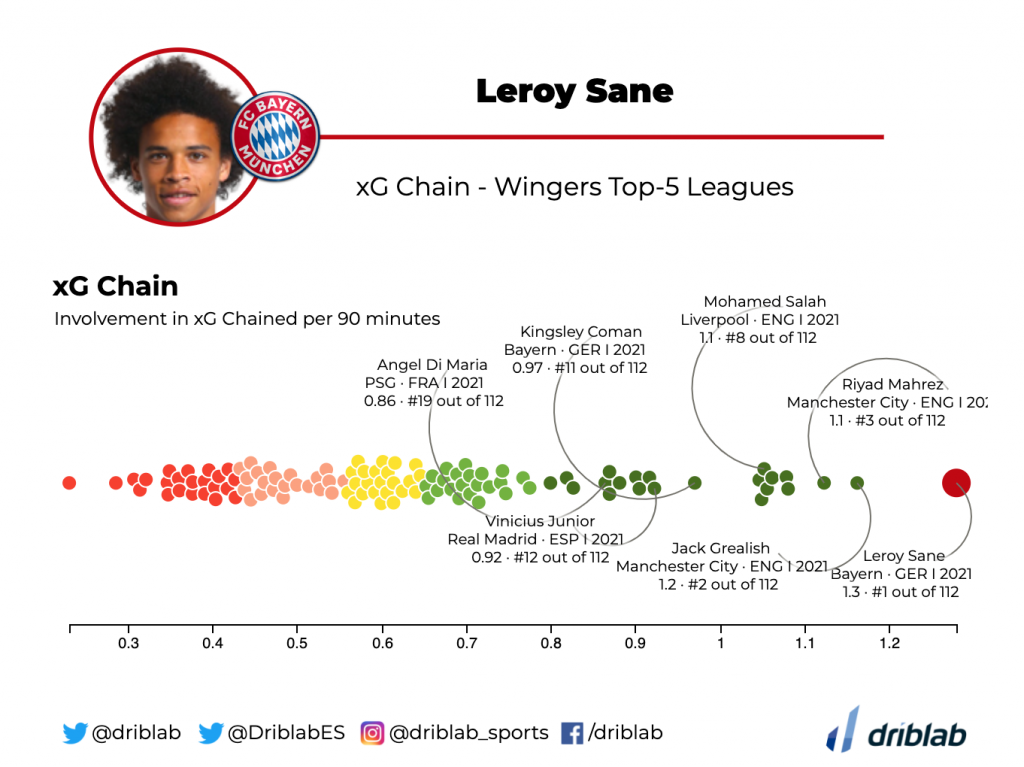
In this graph, the winger in Europe’s top five leagues with the highest share of expected goals per 90′, at 1.3, is Germany’s Leroy Sané.

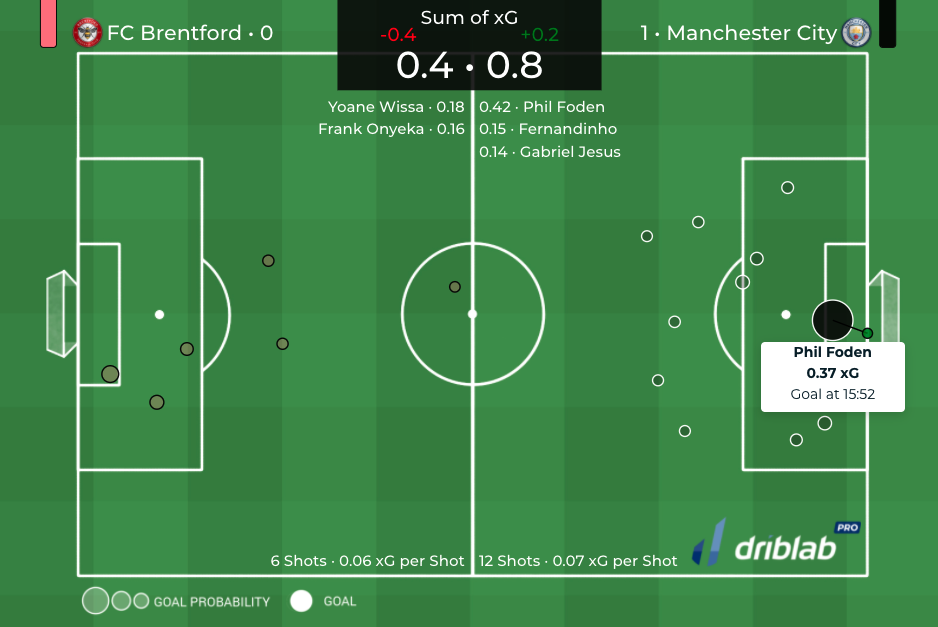
Here we see, in our ‘Possessions‘ feature, a possession started by Gabriel Jesus, which ends in a shot. The play passes through the boots of De Bruyne, then Cancelo, then De Bruyne again and ends with a goal by Phil Foden.

According to our Expected Goals (xG) model, Phil Foden’s goal at 15:52 minutes had a value of 0.37 xG, which will be added to Gabriel Jesus’ xG Chain. The higher the player’s xG value per 90 minutes, the more goals the player has previously been involved in.

We are Driblab, a consultancy specialized in the statistical analysis of players and teams; our work is focused on advising and minimizing risk in professional football decision-making in areas related to talent detection and footballer evaluations. Our database has more than 180,000 players from more than 180 competitions, covering information from all over the world. Here you can learn more about how we work and what we offer.

Autor: Alejandro Arroyo
For Player Analysis we also recommend you:

‘Expected Passing %’: between accuracy and difficulty

How complicated is the pass I just saw on television? It is a question as simple as it is complex. With your powers of analysis and perception you may conclude that it is easy or difficult, or you may put an adverb in front of it to add some degree of difficulty or...

‘driblabPRO Scout’: under-23 left-footed centre-backs with a market value of less than 7M

We use all our filters to find left-footed U-23 centre-backs with good ball handling and aerial skills, with a market value of less than 7 million.

Belgium and Netherlands U21 fullbacks ready for a bigger challenge

We are looking for full-backs in Belgium and the Netherlands who meet the defensive requirements that would allow them to make the jump to a big league.

‘Through balls’: Messi’s latest impossible statistical peak

Leo Messi has no rival in this aspect of the game where he has always been the best. We compare him with other great players.

A goalkeeper today: visualizing his passing ability

We visualize which goalkeepers make more passes in different situations through different goalkeeper-specific metrics.

How the coveted Iván Fresneda plays

We analyse one of Europe’s most promising full-backs. We look at where he stands out and what makes him so sought after.

Counterpressing LaLiga 22/23: Agressive Actions & Quick Recoveries

Counterpressing measured through two specific metrics developed by Driblab at the request of our customers: aggressive actions and quick recoveries.

Darwin Nuñez, beyond a matter of time

The problems in Darwin Nuñez’s definition contain some nuances that the data show in this article.

The seven players who are dominating the World Cup

Ahead of the World Cup quarter-finals, we highlight seven players who are dominating this edition by one metric.

Qatar 2022: Potential signings for Serie A

We list ten players present at Qatar 2022 who could be very interesting options for Serie A teams.

Driblab

Información corporativa

Somos una empresa con sede en Madrid fundada en 2017 por Salvador Carmona y Cristian Coré Ramiro. Desde nuestros inicios nuestro trabajo se ha centrado en el análisis estadístico de datos para ayudar a los clubes en la planificación deportiva. Somos una consultora big data que ofrece servicios personalizados para cada cliente y defiende un modelo de gestión mixto y una comunicación constante para acompañar el día a día de las instituciones. Nuestro punto fuerte es la más amplia cobertura disponible en número de torneos profesionales y juveniles. Para más detalles, póngase en contacto con nosotros.

Colaboramos con:


Hemos aparecido en: