Last week we shared the new developments deployed by our technology team, as we do every quarter. Among them is the ability to automatically download a PDF match report with 16 pages of statistics, maps, visualisations and detailed information, a very useful downloadable feature which we will go into in more detail in this text.
Although all the maps, statistics and visualisations are hosted for consultation in driblabPRO, the downloadable report allows you to have all the information for scouts or analysts in a single file, in just a few seconds and in a joint, organised and structured way, being able to be stored in other information managers, shared between different areas of the club or also as a statistical resource for freelance scouts, journalists or the media. We will discover some contents with the Sevilla – Arsenal Champions League match as an example.
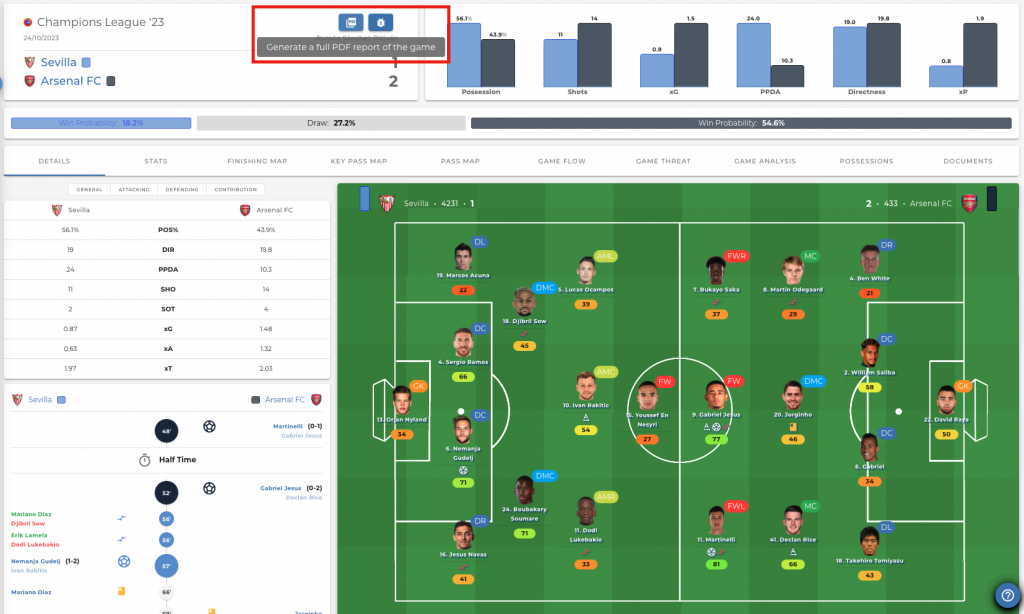
Button to download the PDF report
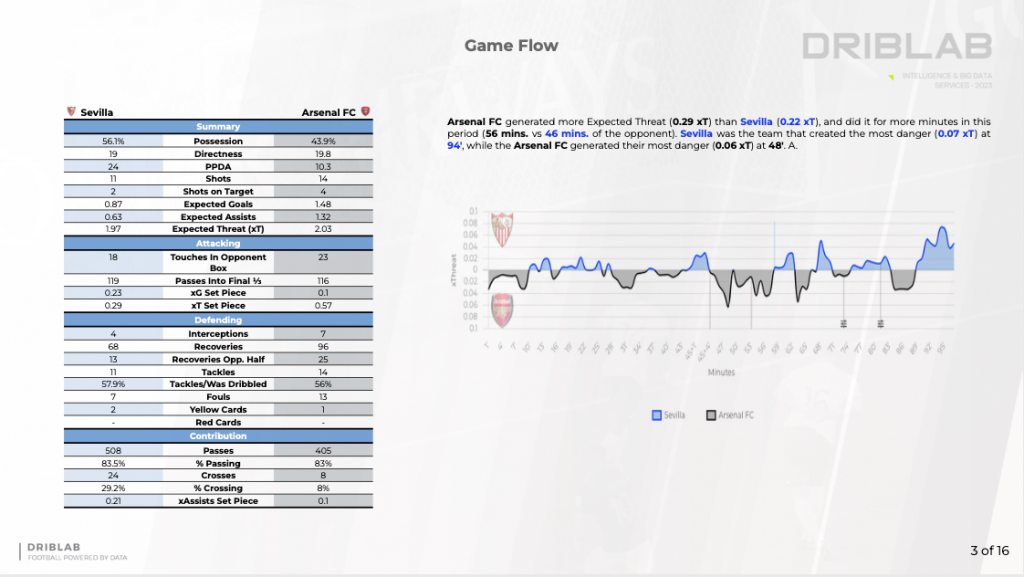
Among the 16 pages that each report contains, we find a summary of 25 statistics and metrics separated by style, offensive, defensive and contribution that gives us a general overview and informs us what type of match was played, which team generated more danger, who dominated for longer or what intentions and approaches were seen through possession, pressure, defence or the generation of chances.
On this first page we show you a match flow chart added next to the 25 statistics, where you can visualise the control and depth of each team by sections of the match. It was a very even match, with no clear dominator, with Sevilla generating more danger in the last stretch, trying to find the equaliser.
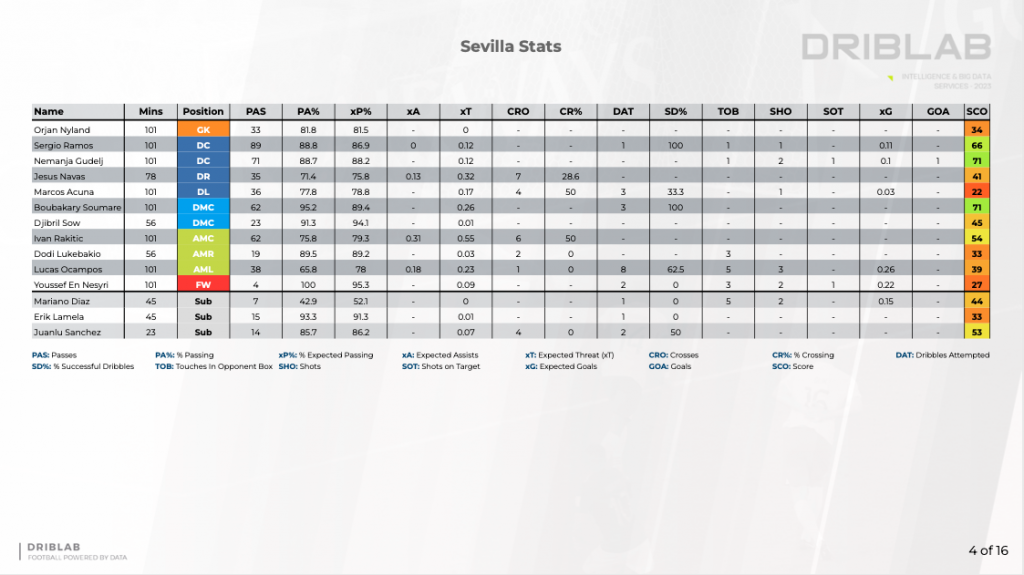
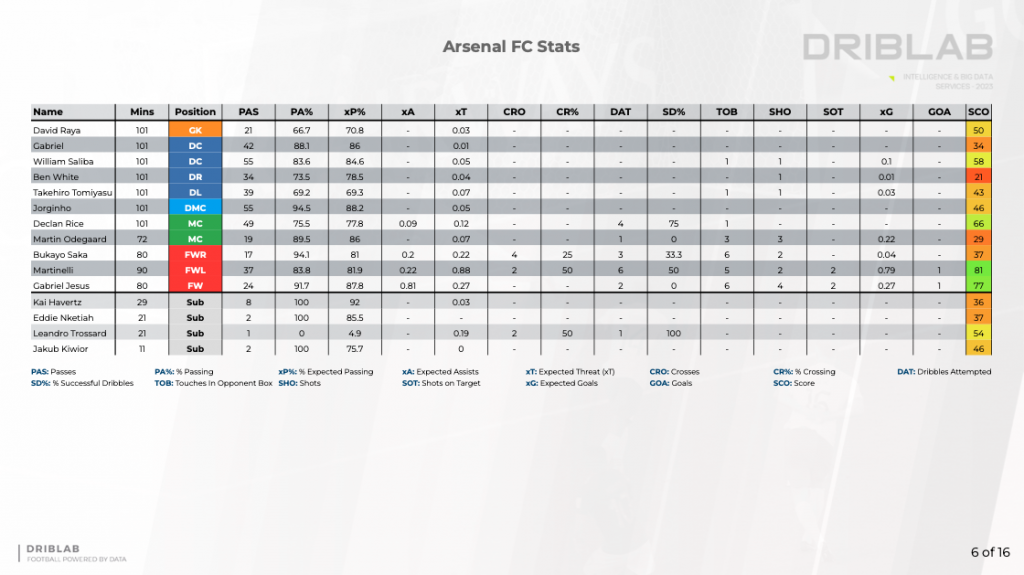
Among the many pages we dedicate to individual statistics, you will find two tables per team, one per page, where you can see which players stood out the most in each metric and what score, according to our Driblab Score, each player had in the match. Among other statistics and metrics, we find: passes, pass success rate, expected pass pattern (xP), Expected Assists, Expected Danger or Touches in the Opposing Area, among many others.
Martinelli and Gabriel Jesus, scorers of the two goals and with very outstanding performances, were the two players with the best Score rating among the 22 starting players. Martinelli was, in fact, by far the most dangerous, with 0.88 in Expected Danger, managing to move the ball into dangerous areas more frequently.
Each report is accompanied by a further 13 slides with different pitch maps visualising shots (xG), key passes (xA) and goalkeeper saving maps.
Founded in 2017 as a consultancy, Driblab has driven innovation through data in all aspects of professional football. Thanks to a transversal model, its database collects and models statistics in all directions. From converting matches and videos into bespoke data for training academies to developing cutting-edge technology, helping clubs, federations and representative agencies in talent scouting and transfer markets. Driblab’s smart data is used by clubs all over the world, with success stories such as Dinamo Zagreb, Real Betis and Girondins Bordeaux among others. Here you can find out more about how we work and what we offer.
