
As anyone who works with Driblab or comes to this blog to read about data, football and performance based on advanced statistics knows, driblabPRO is the platform used by all professionals who hire Driblab to help them make better decisions based on data. From talent discovery to performance analysis. But driblabPRO is used by different profiles. One of those being the analyst within a coaching staff.
The work of an analyst is mainly based on the visualisation of the matches, differentiating between the analyst who focuses on his own team and the analyst whose main duty is to analyse the rival. Focusing on the latter, driblabPRO offers a deep and versatile experience to analyse how the next opponent plays, something to which we have approached a few months ago and that we are going to go deeper into.
How to analyse an opponent using driblabPRO?
The work of an analyst of the opposing team covers different aspects: from extracting a statistical report based on performance trends or injuries, to developing play-making patterns through different video cuts of various situations of their game, set pieces or different methods to progress the ball from the back, as well as weaknesses and strengths that could be used to then develop an operational strategy, to using advanced statistics, such as performance metrics or predictive models, which supply additional information and context to their analysis. Here are some visualisations that help analysts round up their analysis.
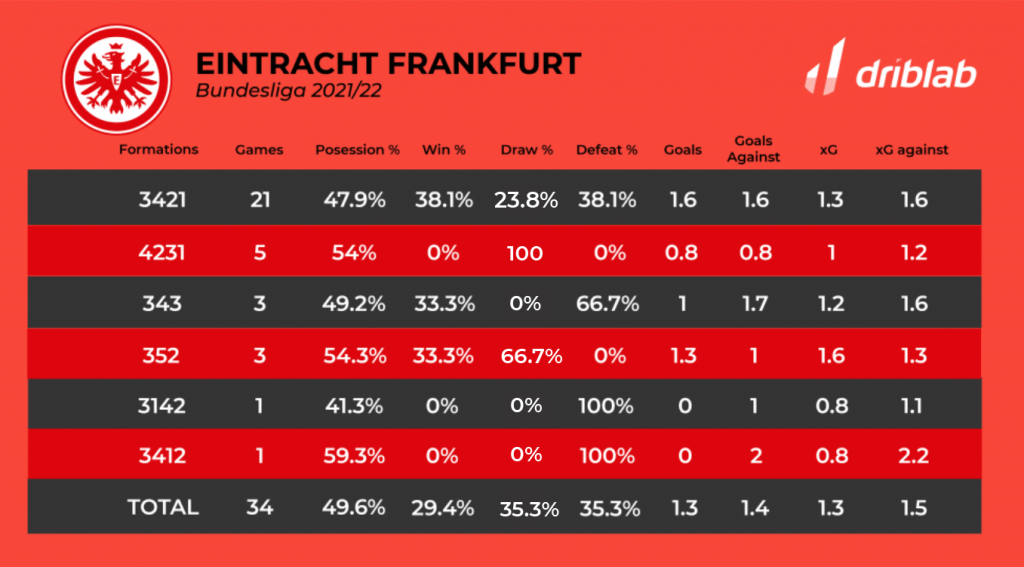
FORMATIONS
In order to know what to expect from the opposition, it is always essential to know what formation(s) they use and how they perform with each one of them, both home and away. Although much more in-depth monitoring would have to be done later, a table regarding formations serves as a starting point.
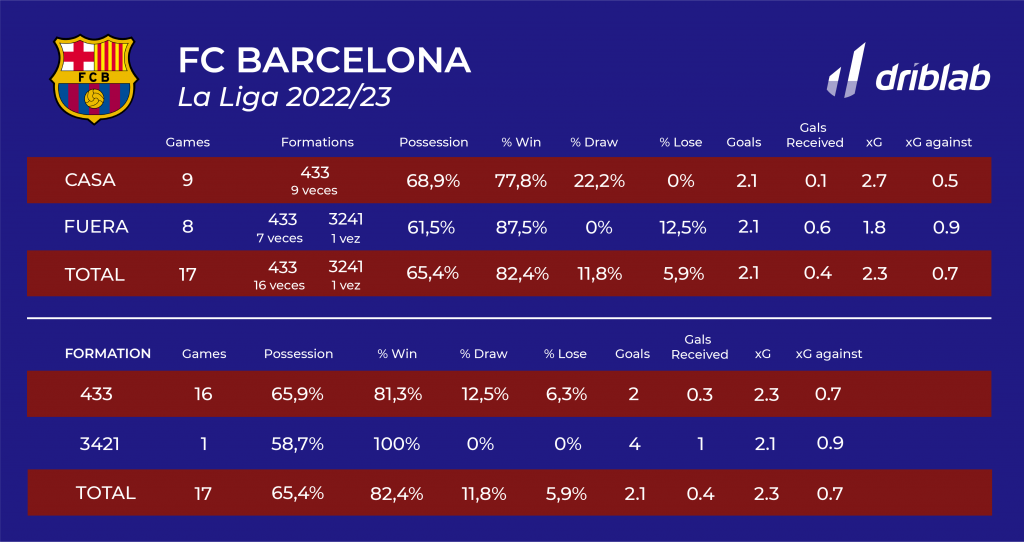
In this case, when using Barcelona there is not much change but if, for example, we were to analyse Eintrach Frankfurt, we would see that it is normal for teams to position themselves in different formations and systems, giving us information about the team’s performance depending on the formation being displayed.
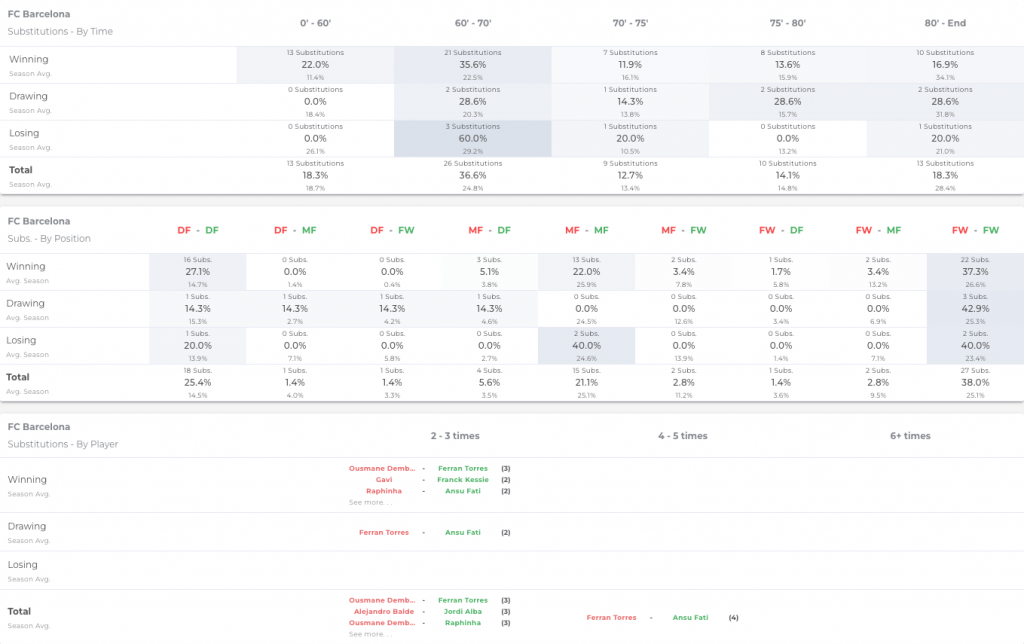
SUBSTITUTIONS
Equally valuable information is knowing when, how much and how an opposing team makes substitutions, knowing how many substitutions each team would make depending on the match situation, in which minutes and which positions they usually change. A truly thorough table that tracks a team’s on-field direction.
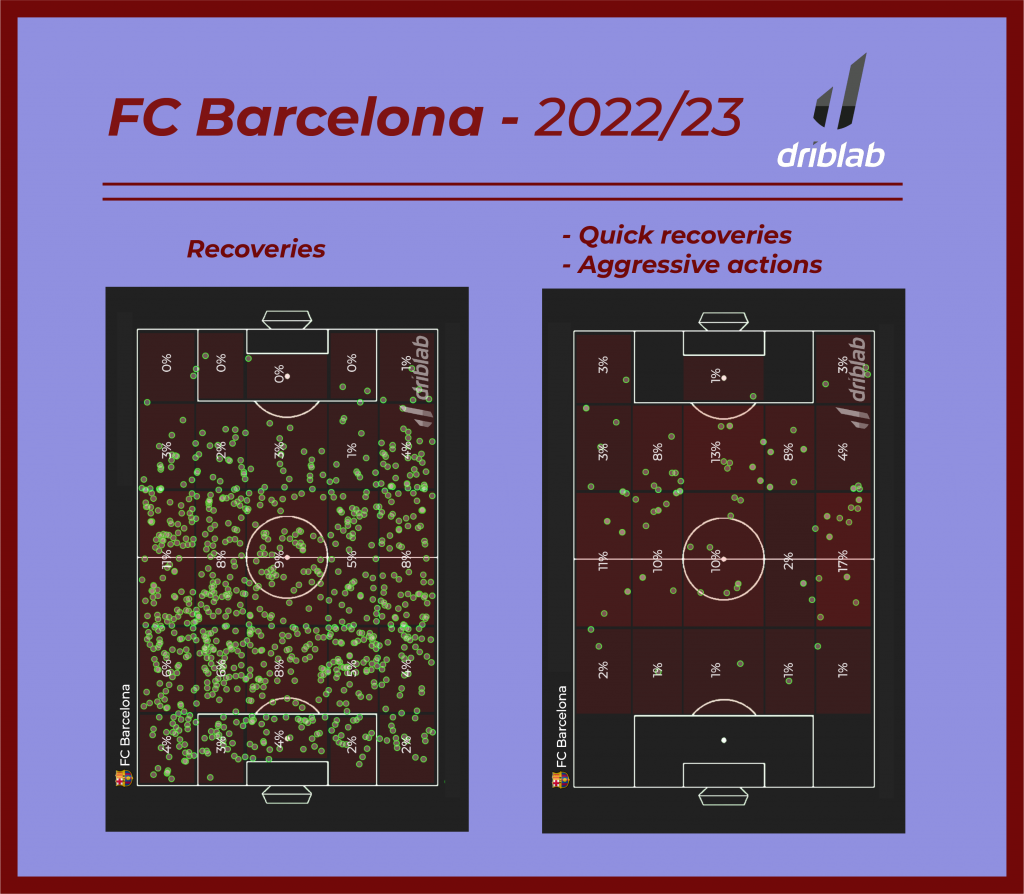
PRESSURE
To know how and how much a team presses, we have the PPDA metric (Passes per Defensive Action), but the maps give us an insight into where the team recovers, in which areas they do it most often and if they also try to recover the ball immediately after losing it. For this we have two very simple and useful visualisations.
POSSESSIONS ENDING IN A SHOT
We have the possibility to visualize every possession that ends in a shot to find ways to progress, including duration, number of touches, number of passes and the xG value generated by the possession and the shot. Here is an example of vertical ball-possession, making the most of open spaces in Lewandowski’s goal in the Super Cup final against Real Madrid.
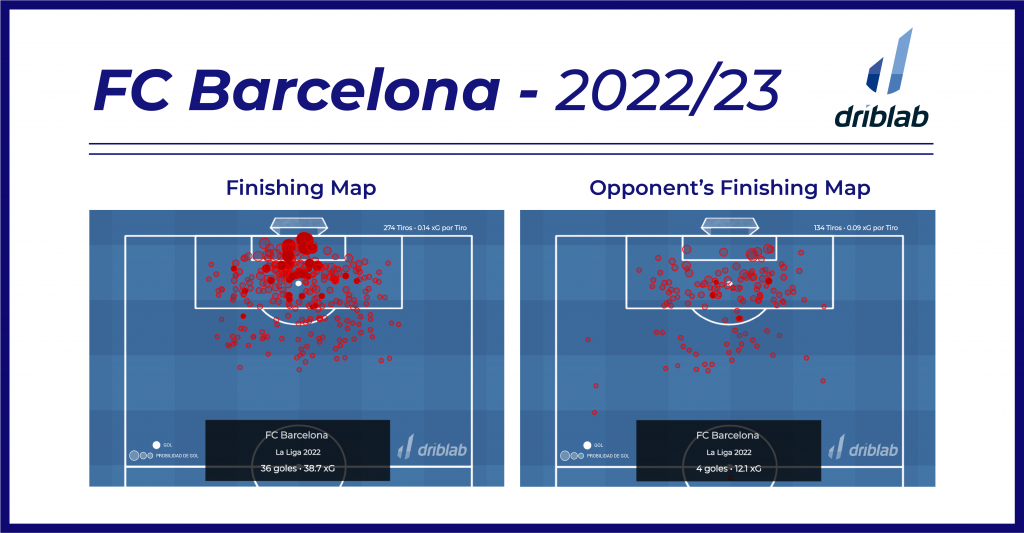
FINISHING and OPPONENT’S FINISHING
The effectiveness in front of goal is measured with the Expected Goals model, a metric that we can visualise both for, seeing how a certain team materialises their chances, and against, to know how many Expected Goals they receive and their capacity to be reliable in front of shots on goal and chances generated by their opponents.
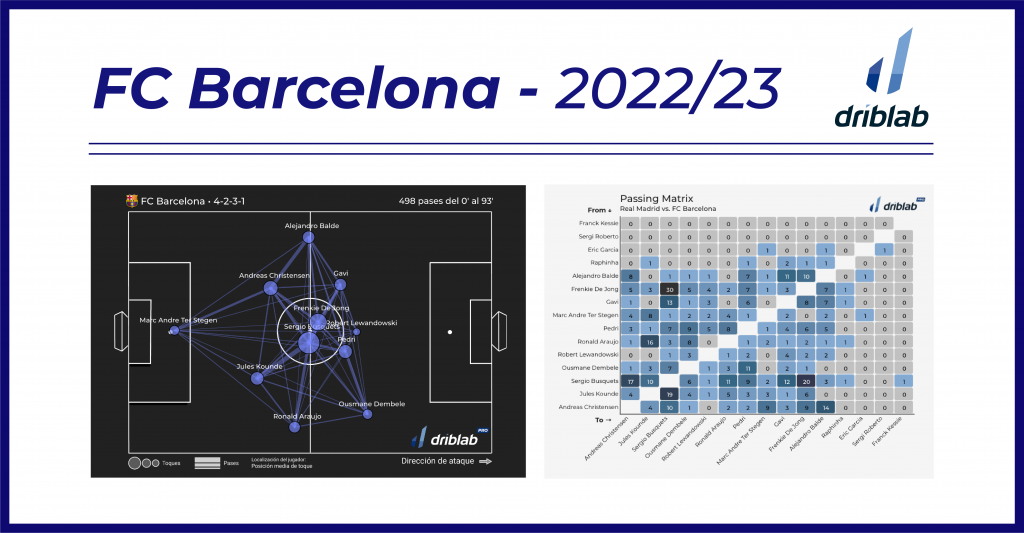
PASSING MATRIX
With the passing matrix, we can obtain information about the most frequent connections between two players within each team and match, as well as the average position of the player when he made a pass or touch, displaying a fixed image of the block’s average height when on the ball and the players who most often connect with each other. All of this can be visualized either on a pitch diagram or on a passing matrix.
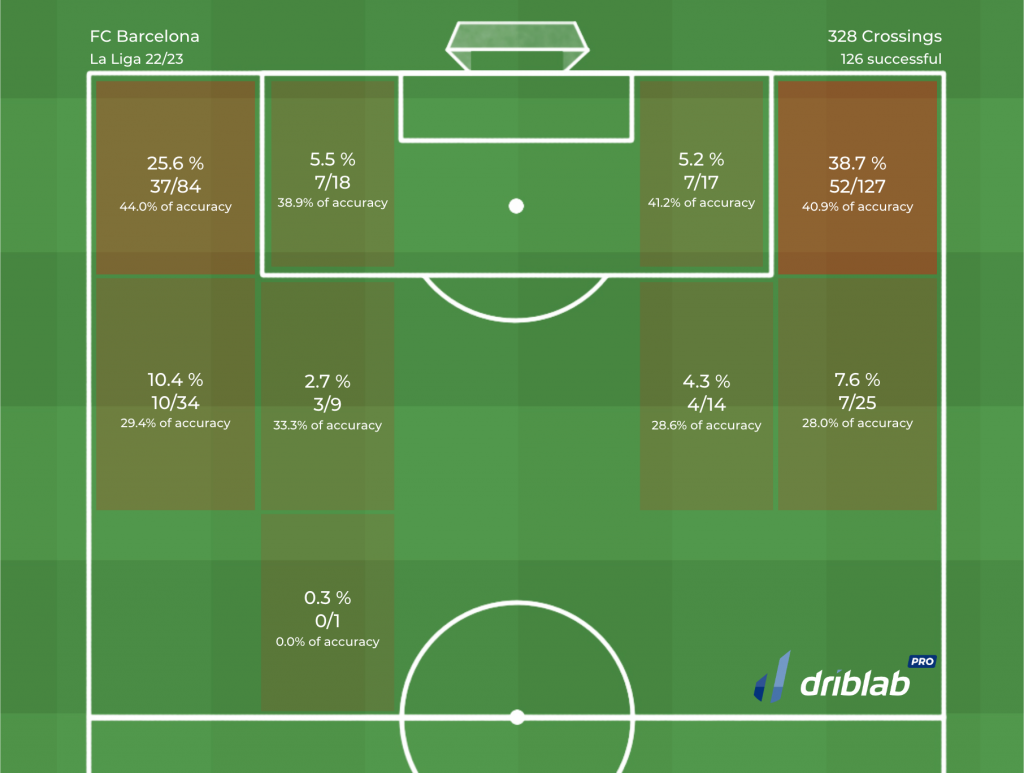
CROSSES INTO THE BOX
This map, which uses percentages that regard a team’s crossing tendencies, will give us clues as to which player or players have the most impact on crosses and how a team develops their game to attempt the cross from one side or the other or if they make them closer to the by-line or if on the contrary they wait to get there to put in the cross.
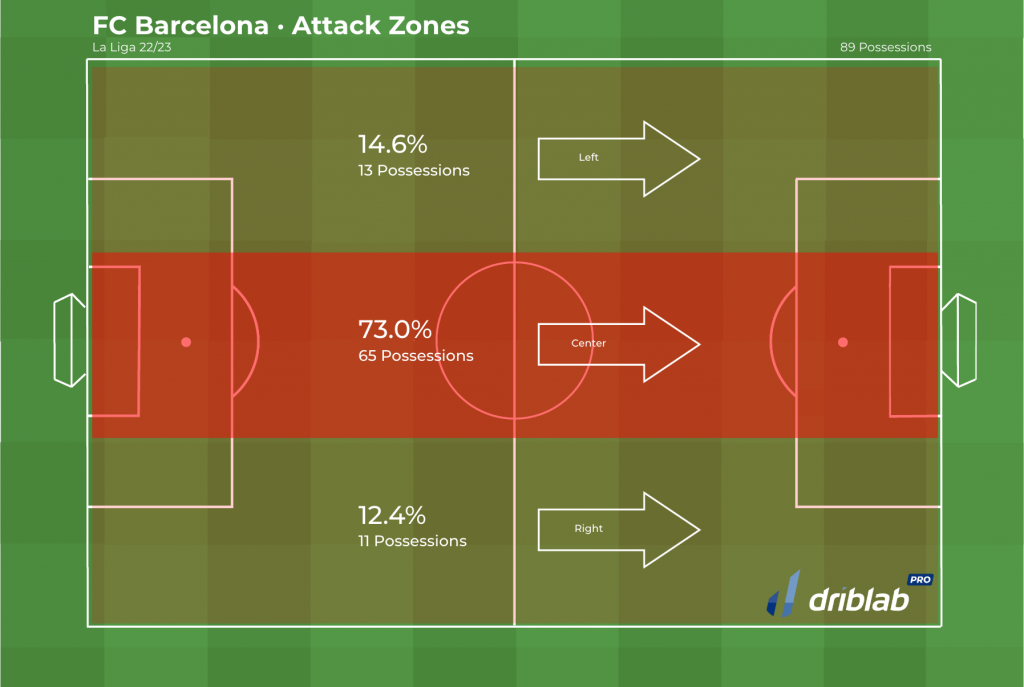
ATTACK ZONES (with possessions that end in a shot)
This map can be selected by where they start, where they end and if they end in a shot or with the ball inside the box. If we select possessions ending in a shot, we find that Barcelona form a funnel that always finishes near or at the area of influence of their centre forward, the extraordinary Robert Lewandowski.
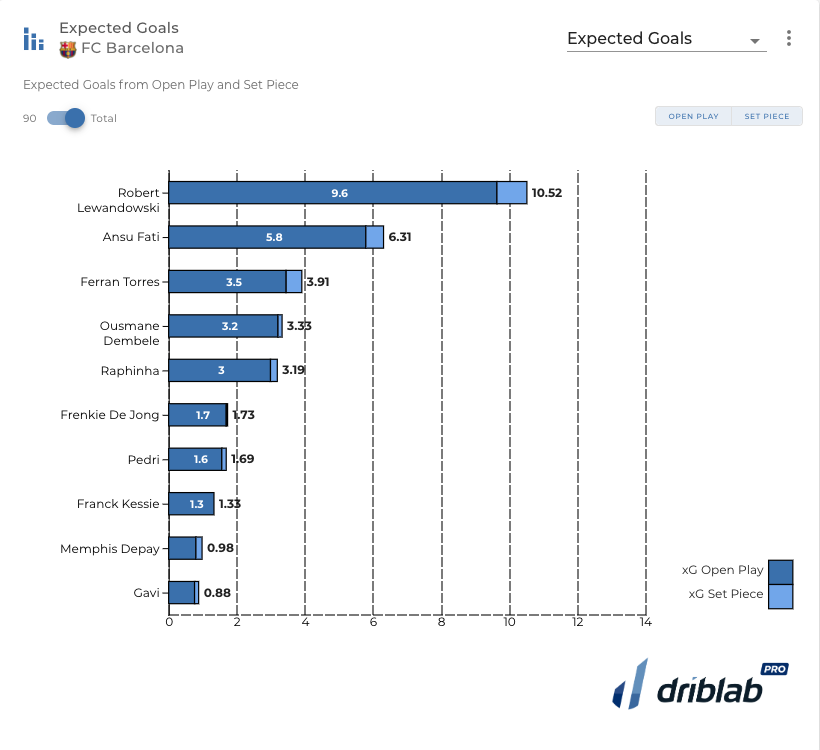
INDIVIDUAL STRENGTHS
This bar chart is made after selecting the Expected Goals metric. However, it can be made using a multitude of metrics (Goal Contribution, Expected Assists, Expected Threat, etc). Knowing which players contribute in one metric or another can alert us on how relevant a player is on his team’s attack.
We are Driblab, a consultancy specialized in the statistical analysis of players and teams; our work is focused on advising and minimizing risk in professional football decision-making in areas related to talent detection and footballer evaluations. Our database has more than 200,000 players from more than 180 competitions, covering information from all over the world. Here you can learn more about how we work and what we offer.


