
Possession as a concept in football opens many debates and closes none. Unlike in basketball or handball, where the clock is ticking on your ability to have the ball to produce immediately, this is not the case in football. Teams have the ball many times but the vast majority of them do not produce direct action on goal, as is the case in handball sports. Ultimately, stealing the ball from someone’s hand is more difficult and that is why a possession clock is set up, so that actions follow one after the other and force a shot. With feet it is easier to lose it, so both teams are going to have a lot of possessions continuously.
Statistically, possession percentage was the starting point, but it has become completely obsolete as a valuable and productive indicator of a team’s performance. In fact, it tells us virtually nothing. But it does when teams shape their possessions with their intentions: by the number of passes each team makes each time they possess the ball and the distance each of those possessions travels.
With these two indicators we will be closer and more informed about the quality and style of a team’s possessions. It is not the same for a team to add eight passes or two each time they have the ball, and it is not the same for a team to advance 29 metres or 21 metres per possession. That’s why ‘Passes per possession’ and ‘Distance per possession’ are born. They are not the only metrics we have to measure the quality, style, directness and threatness of a team’s possessions but they do give us much more productive insights than the percentage of time a team has the ball.
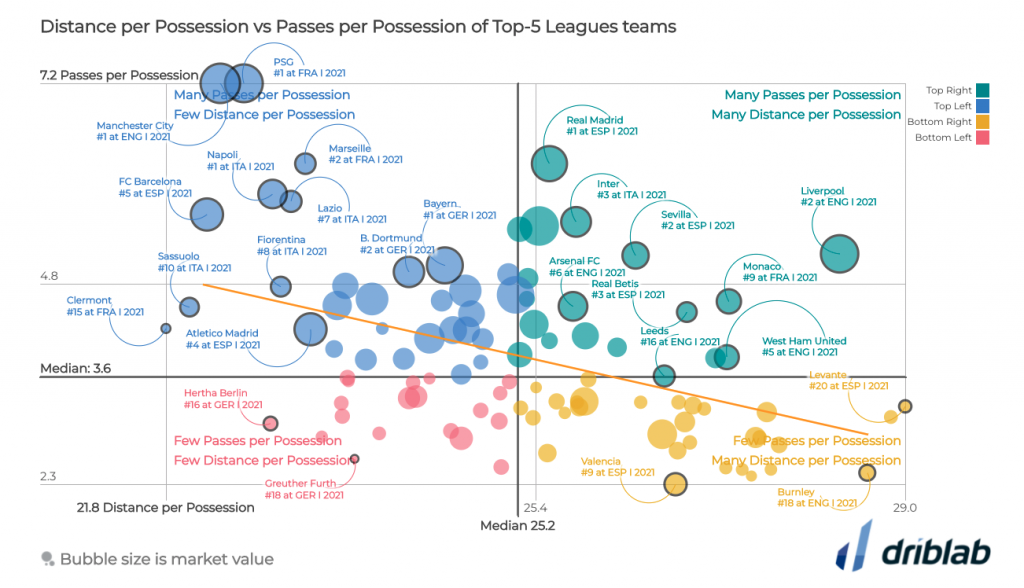
With these two metrics and their visualisation in the scatterplot we can see which teams have the most elaborate possession, as well as the style of their passing and the directness of their passes through the metres covered per pass on average. For example, Manchester City and Paris Saint-Germain have a lot of time on the ball, with short passes. On the other side, we will find teams that give very few passes per possession and try to cover many metres with each pass, probably because they cannot dominate the matches and have to play very direct, which is the case of teams in difficulty and with less quality: Cadiz, Levante, Burnley.
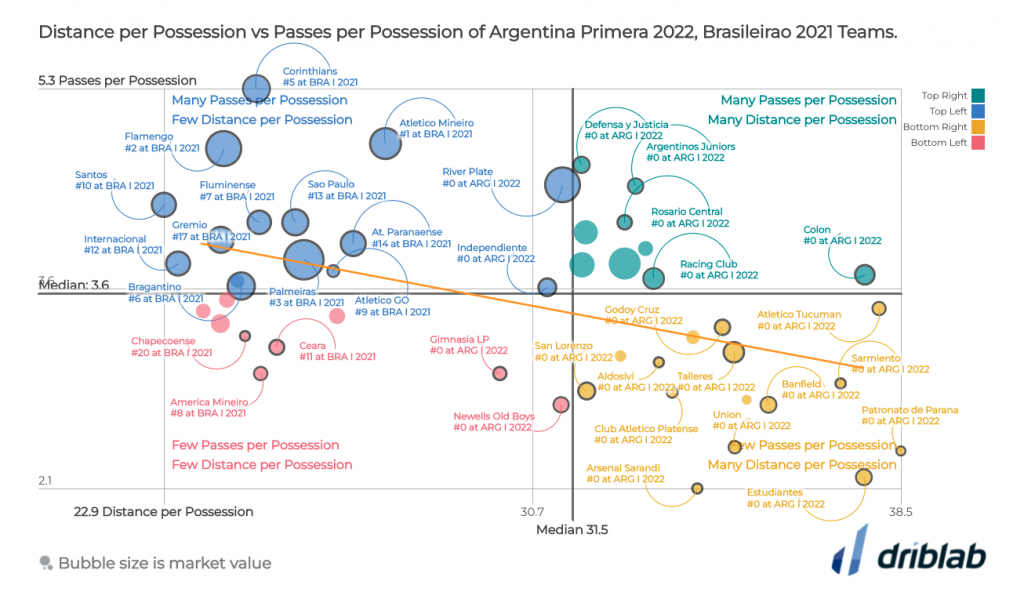
These two interrelated metrics can also give us very important clues about the style of a league. In the graph below, we have chosen the Brasileirao and the Argentinian league to compare how the game is played in each country. And the difference is striking. Half of the graph to the left is occupied by all the Brazilian teams – more passes per possession and less metres covered = teams that play more elaborately and play closer together – while the other half is made up of all the teams in the Argentinian league – less passes per possession and more distance covered per pass = more vertical teams. A very radical example is Patronato, who on average cover 38 metres per pass and barely pass two passes on average.
We are Driblab, a consultancy specialized in the statistical analysis of players and teams; our work is focused on advising and minimizing risk in professional football decision-making in areas related to talent detection and footballer evaluations. Our database has more than 180,000 players from more than 180 competitions, covering information from all over the world. Here you can learn more about how we work and what we offer.


