
Never in the history of football has the ball or the player been pressed collectively and at such an organised and sophisticated level as in the last ten years in world football. Somehow a very advanced point is being reached after a temporary process fuelled by a stream of ideas, coaches and methods that are converging now and in a multitude of leagues. In the face of physical and tactical evolution, creating and exploiting space by stealing forward has been a great opportunity to generate scoring chances.
A scatter plot is a way to visualise performance in a very direct way and with fantastic options to relate more specific game situations. A few months ago, we looked at which teams in the top five leagues were generating the most expected goals from set pieces, extracting their percentage of the total to see who was generating the most points from free kicks or corners. This time, to measure which teams are pressing well and which not so well, we can relate the PPDA (Passes per Defensive Action) metric to the shots conceded per 90 minutes. With this connection between the two we can see how hard teams press and what toll they pay for it, and we can gauge the quality of that pressing. The less PPDA and the fewer shots taken, the better that team is pressing. Among so much quantity, we look for quality.
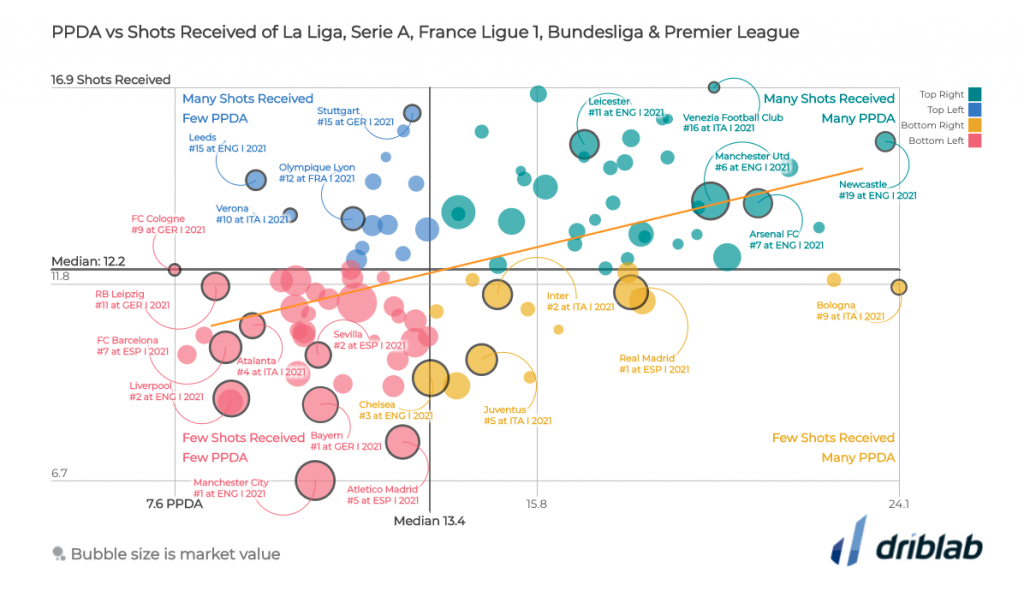
To specify what we want to count, we will insist on the PPDA concept, which measures the number of passes that an opponent is allowed to make before carrying out a defensive action, so to know which teams press more we will look at those with less PPDA. By allowing fewer passes to the opposition, the more pressure they will be putting on them for each possession they have, hence, in the graph, the less PPDA and the fewer shots they receive, the closer we are to concluding that their pressure is superior to their opponents’ possession.
While we cannot conclude conclusively that a team is underperforming by looking at these two issues, as it may form part of their style of play by taking that risk as part of their identity, as in the case of Bielsa’s Leeds, we can get an idea of what happens in their games, at what pace the play develops and whether the pressure reflects a defensive security living away from your own goal and that aggressiveness in defending translates into few shots conceded.
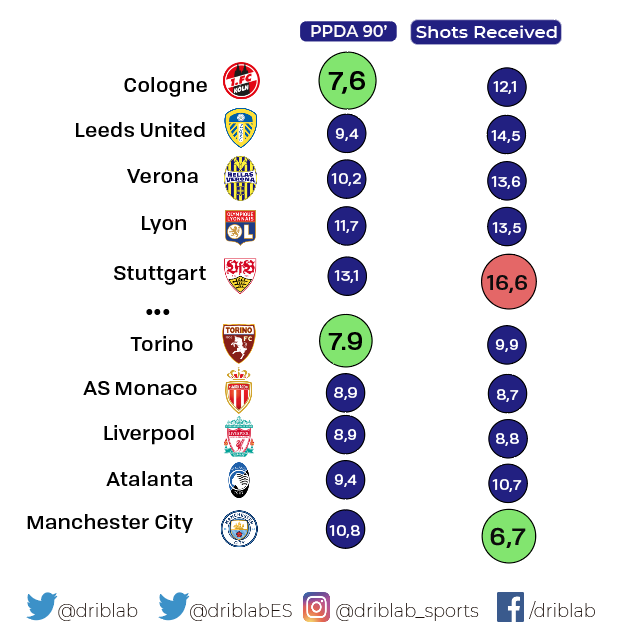
The aforementioned Leeds or German Cologne – the lowest PPDA team of the top five European leagues – are two teams that put a lot of pressure on the opposition, but at the cost of conceding a lot of shots per game. By contrast, the team that comes closest to getting the most out of their pressing attitude is Manchester City, who we need to analyse in many other ways to understand their defensive solidity, but they are certainly a team that dominates the opposition without conceding many shots. Finally and in the same way, as the first graph shows, we can also look at which teams press less and which, among them, take more or fewer shots per game.
We are Driblab, a consultancy specialized in football analytics and big data; our work is focused on advising and minimizing risk in professional football decision-making in areas related to talent detection and footballer evaluations. Our database has more than 180,000 players from more than 180 competitions, covering information from all over the world. Here you can learn more about how we work and what we offer.


