
The Expected Goals model that measures the probability of a shot becoming a goal has multiple applications, not only to measure the effectiveness of strikers or players who have a chance to shoot or goalkeepers who face the derivative Expected Goals on Target but, for example, to analyse, with the variant xG per Shot, the average quality of the chances. With this value and a complete shot map, we can know if a player is trying clear shots or, on average, trying his luck from very far positions and where the probability of scoring is very remote.
The xG per Shot also has ways of being applied at a collective level, as we will see below. Obviously, this way of approaching such a complex reality as defending in an orderly or effective way is only an approximation that we should not treat as a single value, but it will discriminate between disparate performances and will reveal the defensive problems of the teams and the difference in quality.
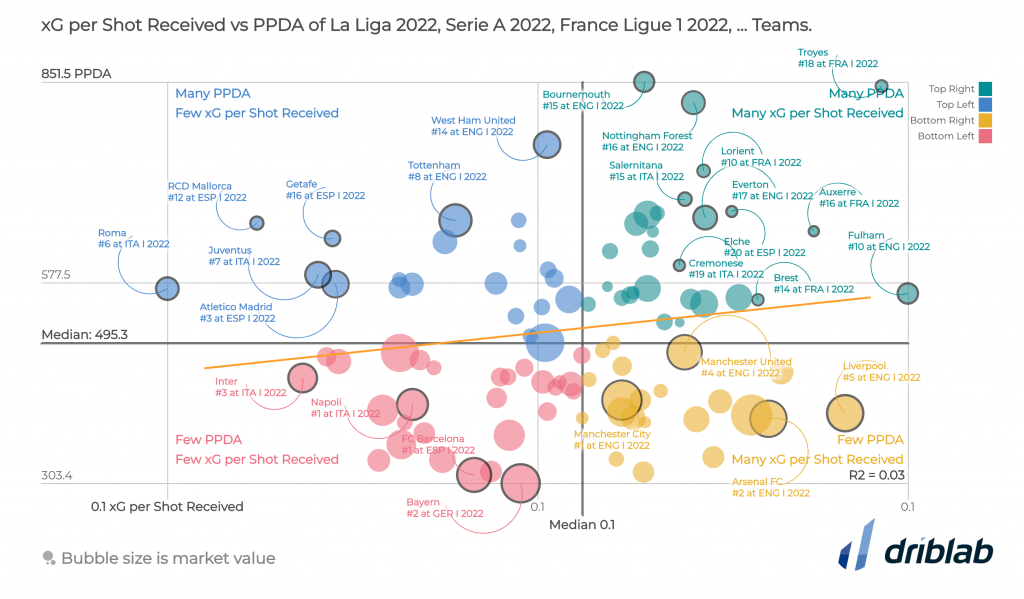
This scatter plot crosses xG per Shot Received with PPDA (Passes per Defensive Action). We are looking to see which teams are pressing hard and which are defending lower, being passive in forcing turnovers or pressing passes, and how their defensive choice translates into reducing the quality of the opposition’s shots.
There is a certain and repetitive correlation between ambitious, individually talented teams with a big budget, who play a lot of time in the opposition half and want to win the ball back as high up the pitch as possible and who in turn get very clear shots and chances, i.e. from a very high xG per Shot, but it doesn’t have to be that way. Nor does it have to be methodically related to defending very deep, close to the goalkeeper and accumulating many men in the central lane and receiving few shots.
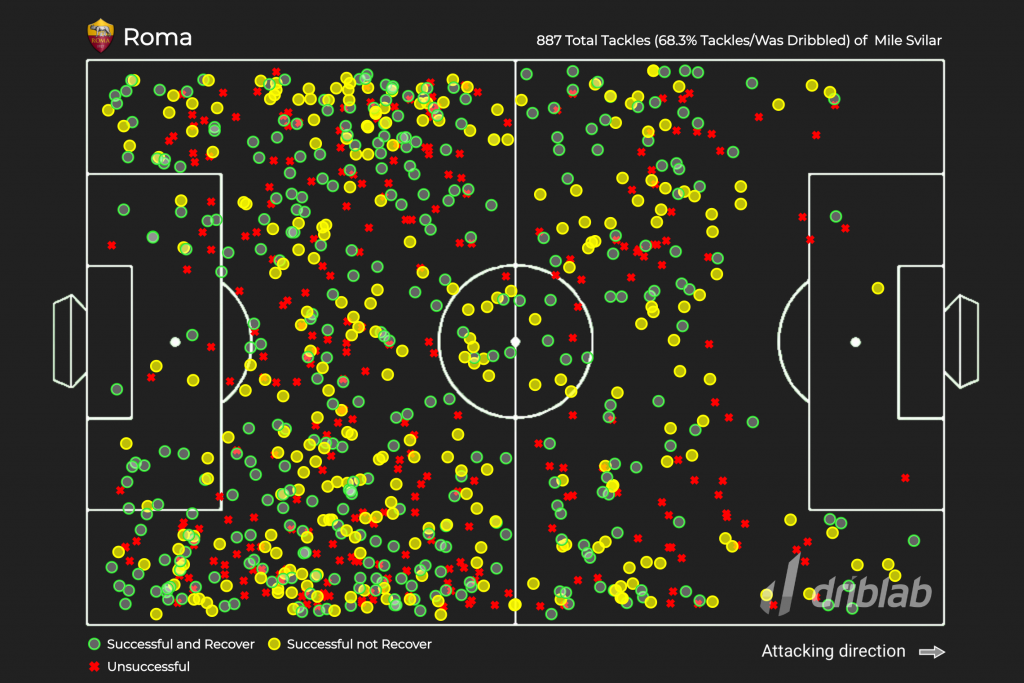
In the graph we find Roma as the team that receives the fewest xG per Shot and a PPDA of 15, which shows that they do not press high but that they do a collective work of great involvement of their players. If we look at their tackle map, they are not a passive defensive team but active and very well coordinated, which makes it very difficult to penetrate and find clear chances and wide spaces.
The dispersion map gives us information about what happens with teams that are fighting for relegation or have already lost the category, such as Elche, Troyes, Auxerre, Notthingham Forest or Bournemouth. Teams that, even when defending at the back and closing spaces, do not have the quality to prevent clear shots and concede goals.
On the contrary, there are many Italian teams that are bold in pressing, that play with a lot of distance between goalkeeper and goal or that use that pressure very well to avoid being too exposed, such as Napoli and Inter, unlike other teams with a lot of pressure that do suffer clearer chances and a higher xG per Shot, such as Liverpool or Arsenal.
Founded in 2017 as a consultancy, Driblab has driven innovation through data in all aspects of professional football. Thanks to a transversal model, its database collects and models statistics in all directions. From converting matches and videos into bespoke data for training academies to developing cutting-edge technology, helping clubs, federations and representative agencies in talent scouting and transfer markets. Driblab’s smart data is used by clubs all over the world, with success stories such as Dinamo Zagreb, Real Betis and Girondins Bordeaux among others. Here you can find out more about how we work and what we offer.


