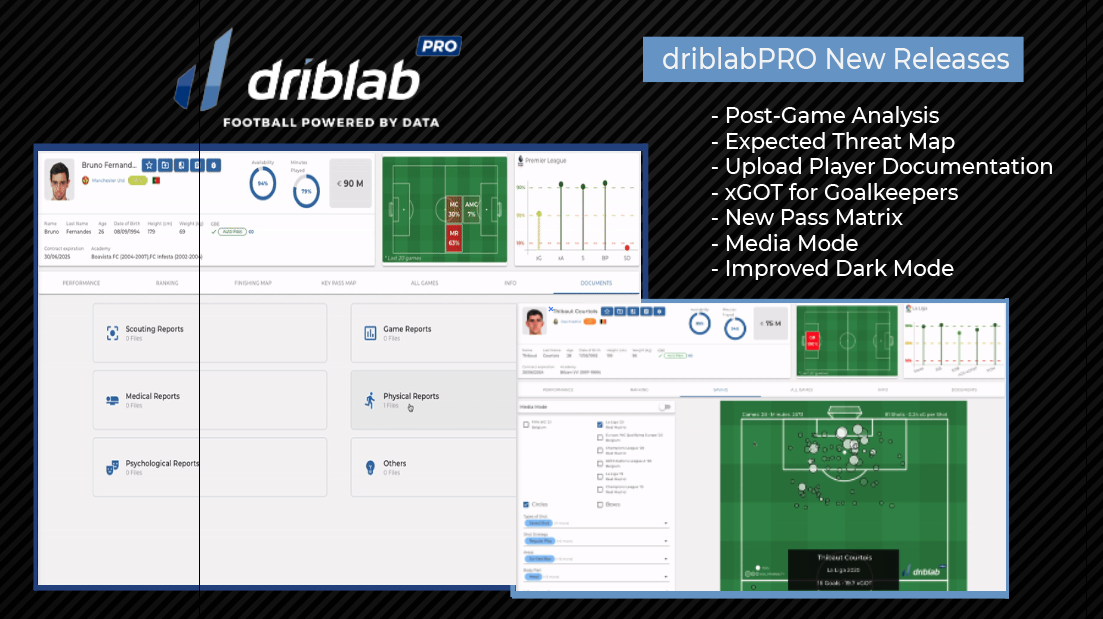
During the month of March we have developed new tools at driblabPRO that expand the resources we provide to our clients. Here are the details of the month’s new releases:
Post-Game Analysis
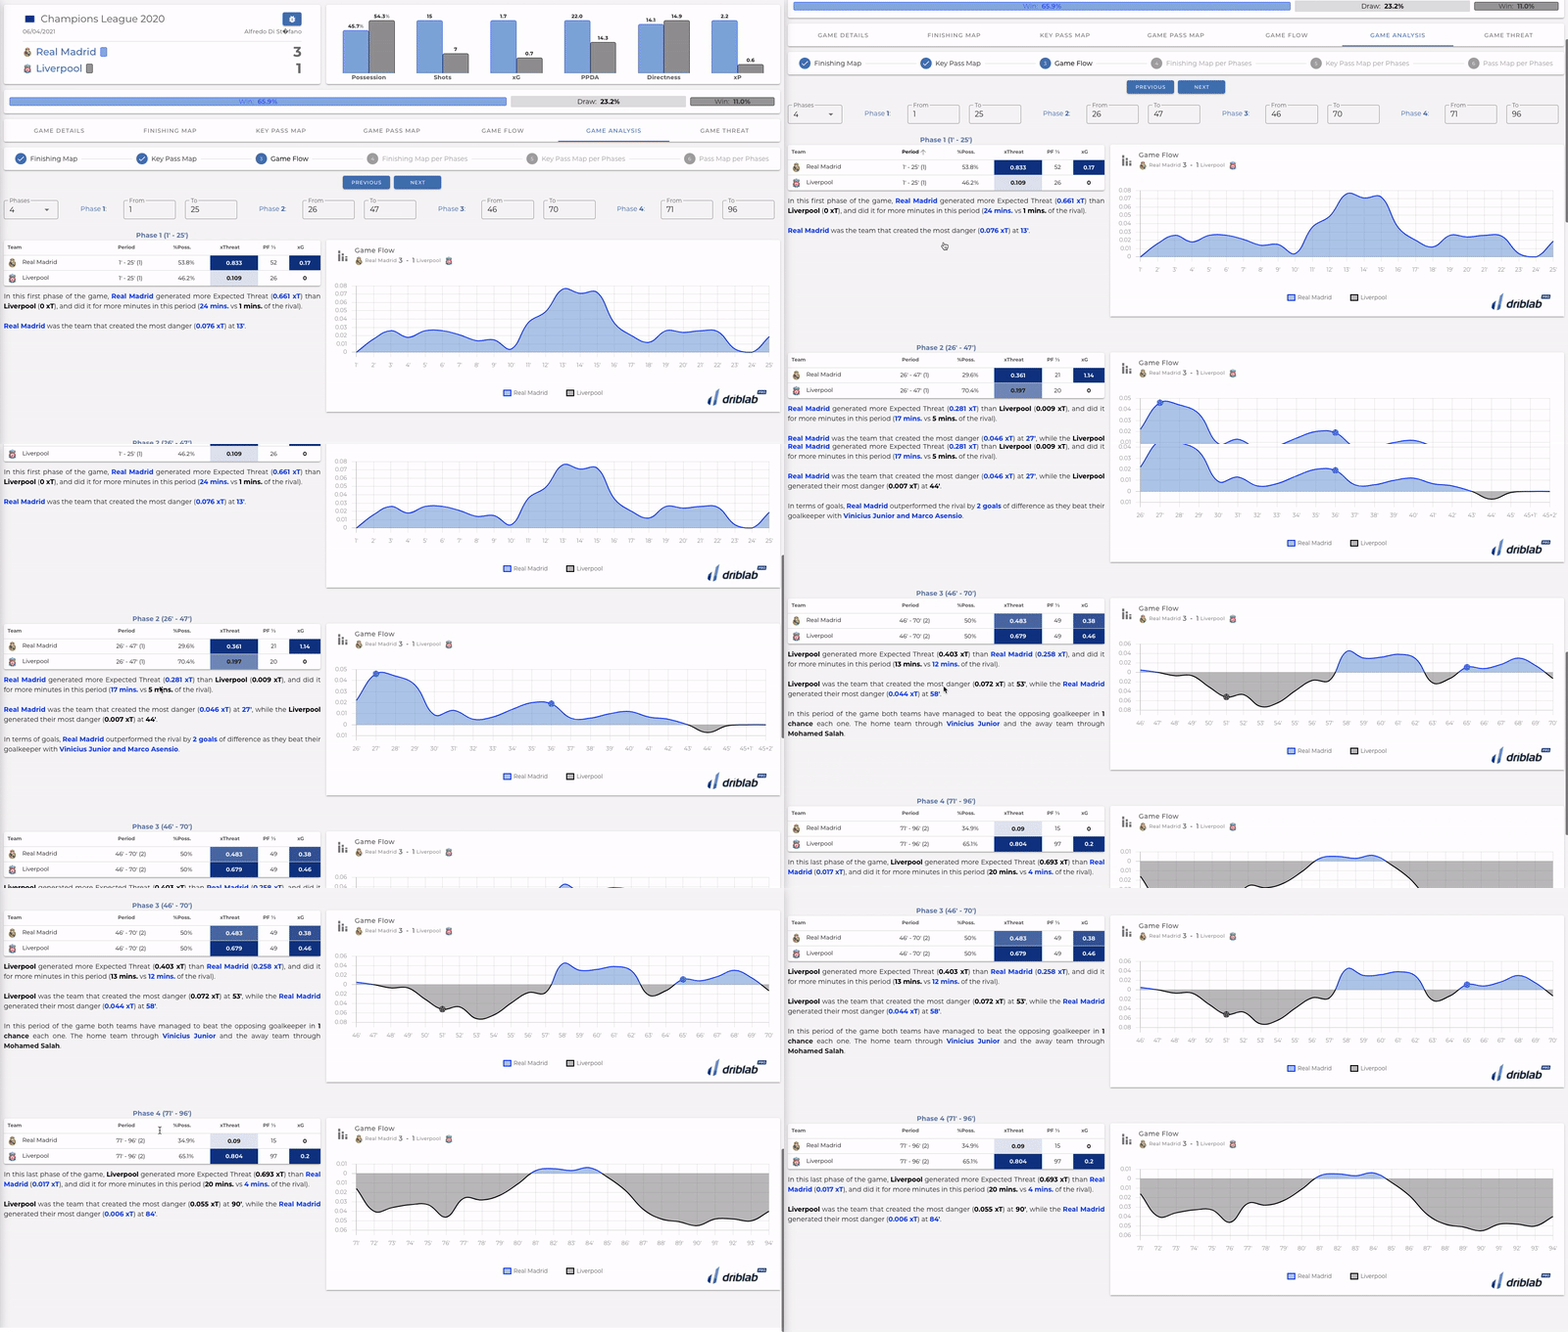
Following the match, managers and analysts carry out the process of understanding what was correctly done and what was incorrectly executed. Today at Driblab we present a new feature that will allow to figure out in an easy, comprehensive approach the best and worst practices of the team during the match duration. Find more information about this feature here.
Expected Threat Map
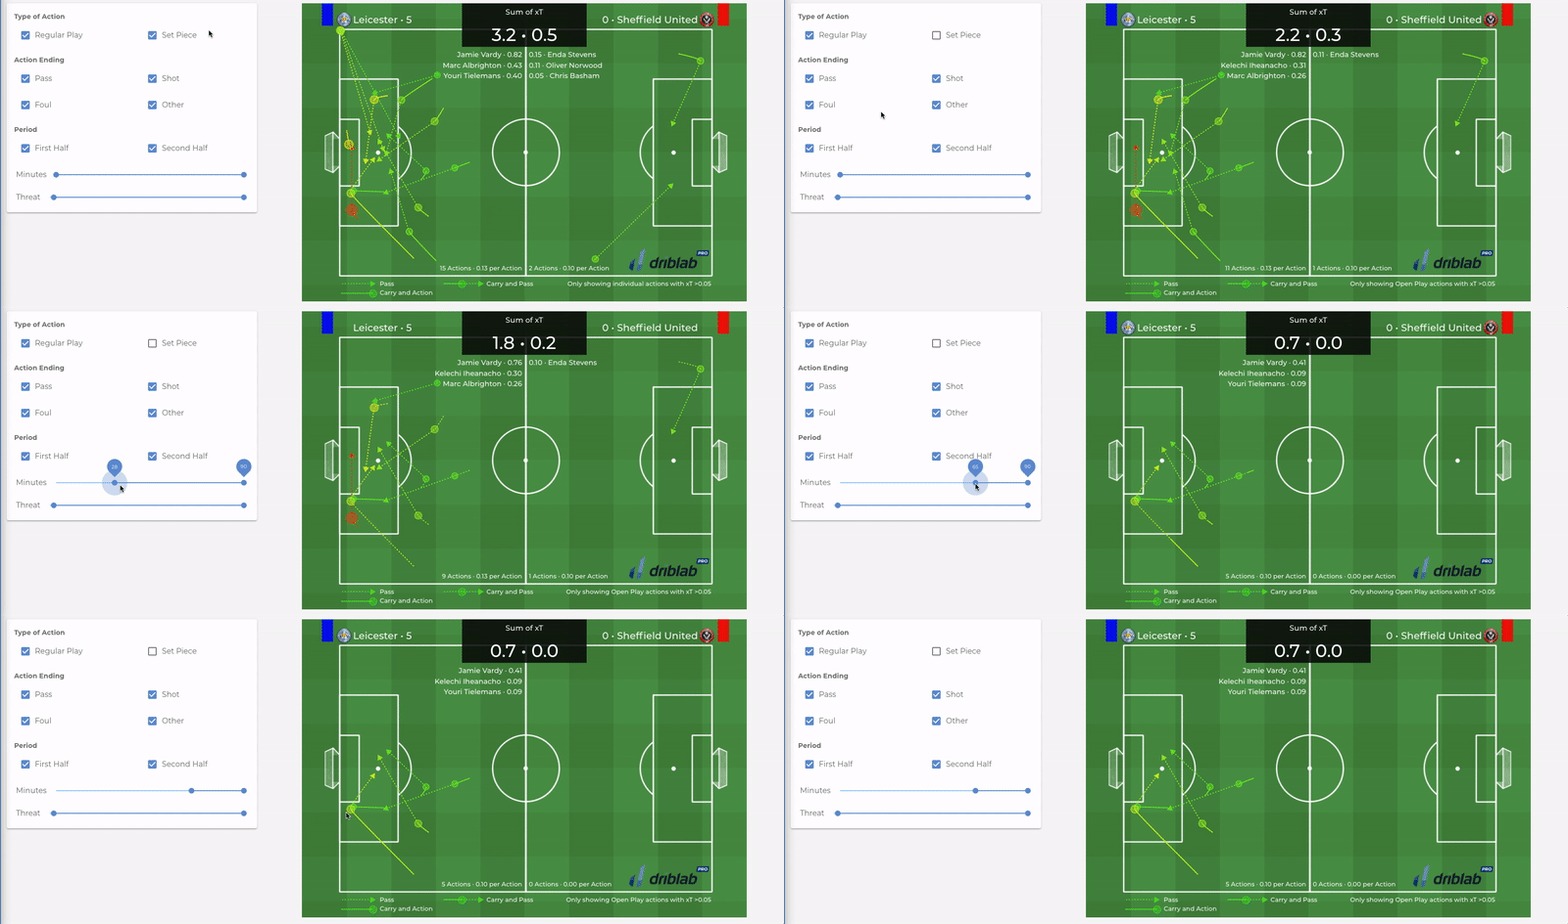
To evaluate the offensive performance of a team, Driblab presented two weeks ago its new game analysis tool: Expected Threat Map. The interactive feature allows to display the moves that generated the highest threat for the opponent, providing efficient support to understand the game flow of the match. Find more information about the xT Map here.
Upload Player Documentation
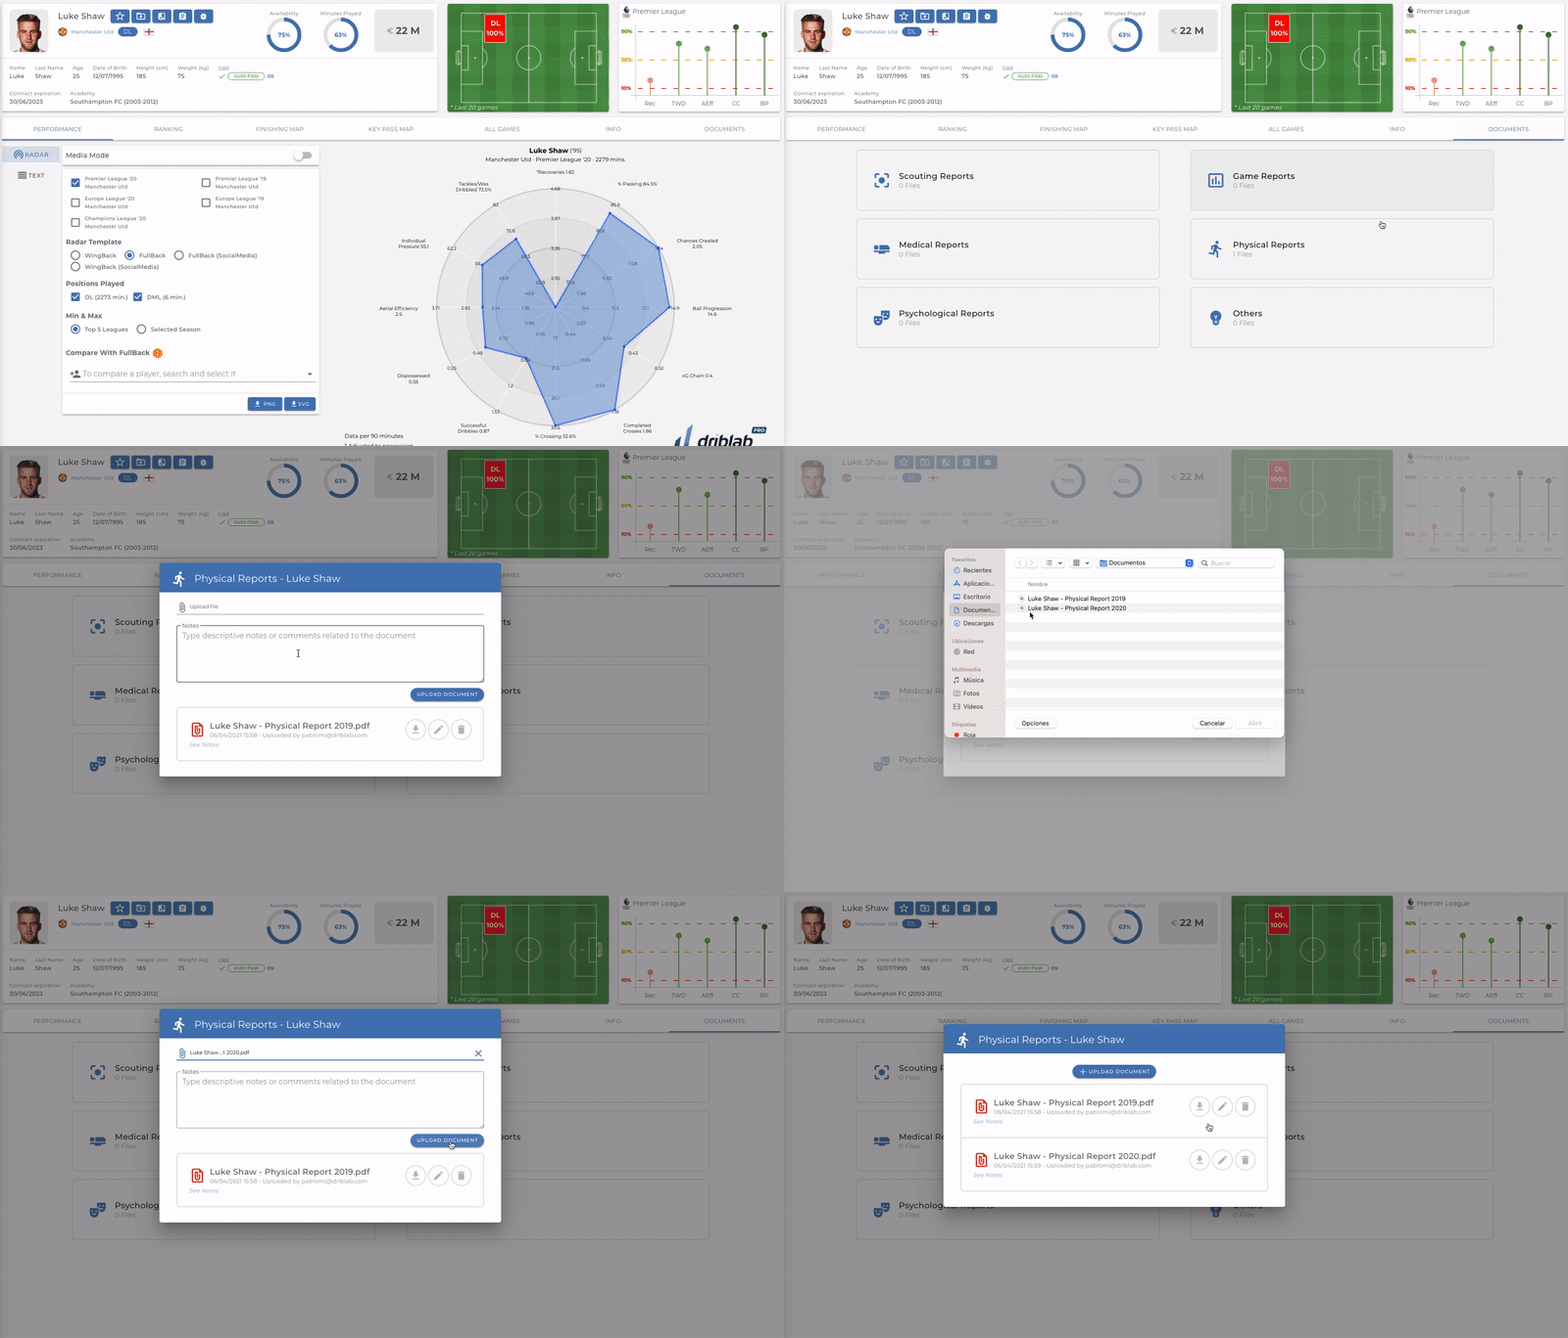
Having a shared area to share documentation with the rest of the coaching staff can be helpful for data analysis. For this purpose, Driblab launched a new tool that allows players’ documents to be uploaded and stored online. Users will be also able to download, rename or delete them on demand.
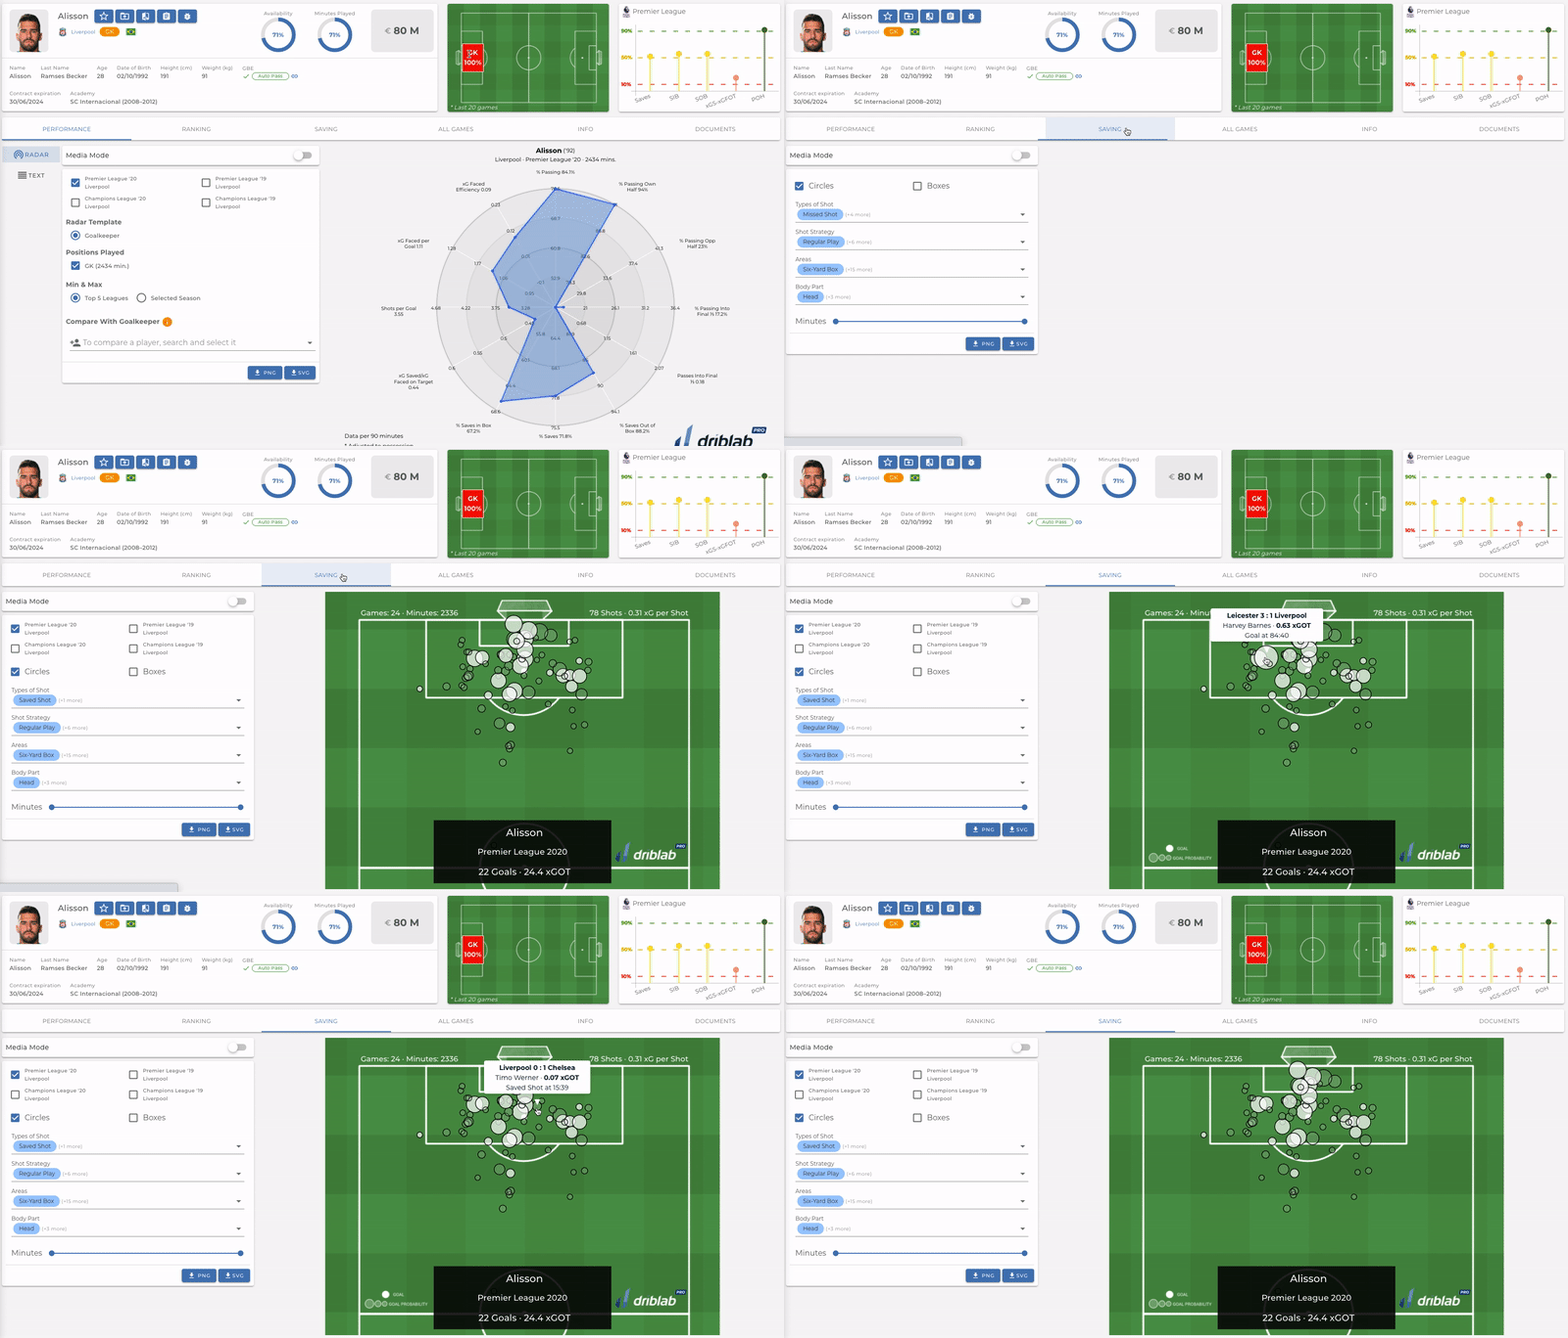
xGOT for Goalkeepers
Goalkeepers only interact with shots that go on target, saving or not saving them. Because of that, when measuring the performance of a goalkeeper, all the shots that are not on target should be disregarded. xGOT (Expected Goals on Target) only takes into account the number of shots on target, removing shots that miss the goal or those blocked by defenders.
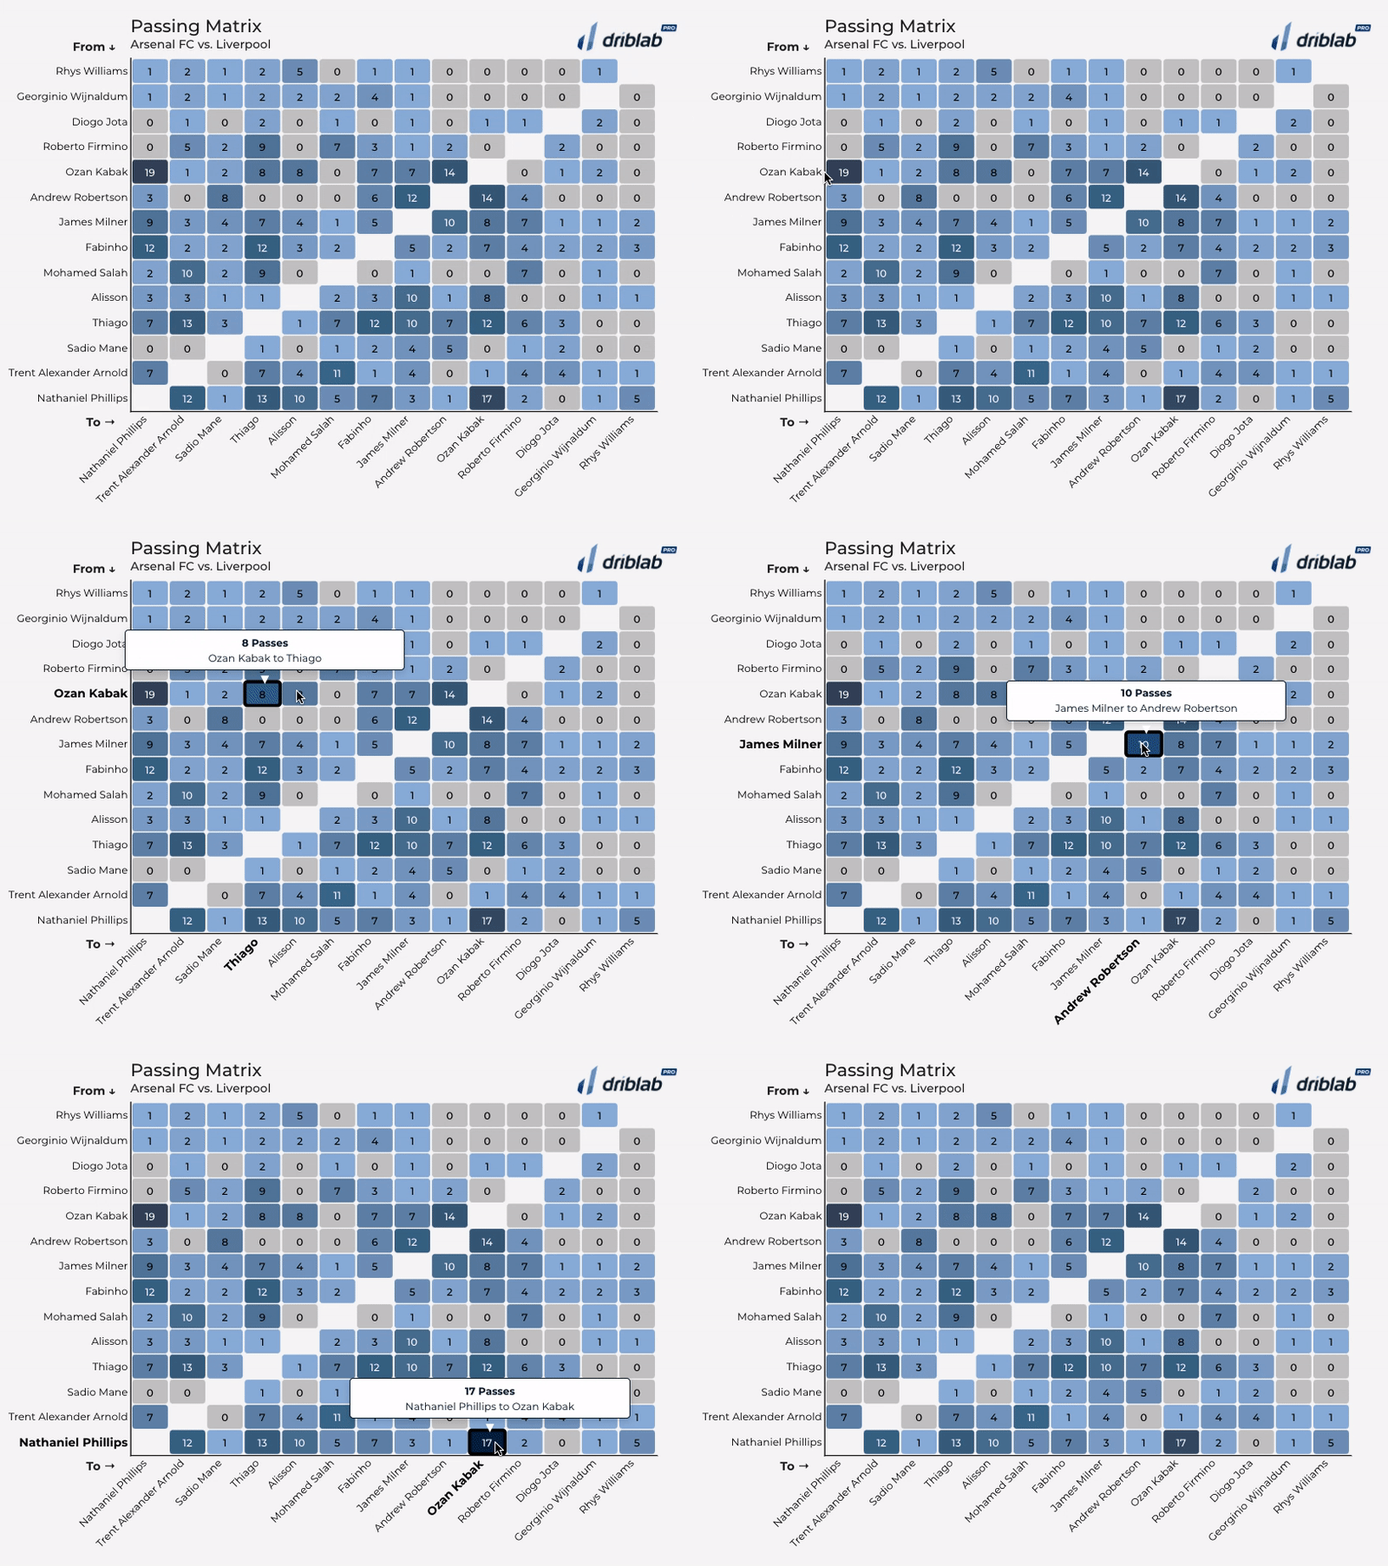
New Pass Matrix
To analyze the passes executed during the game, Driblab has released this new visualization that provides a comprehensive view of the interaction between players on the same team. With this feature, the user can quickly find the most common pass combinations.
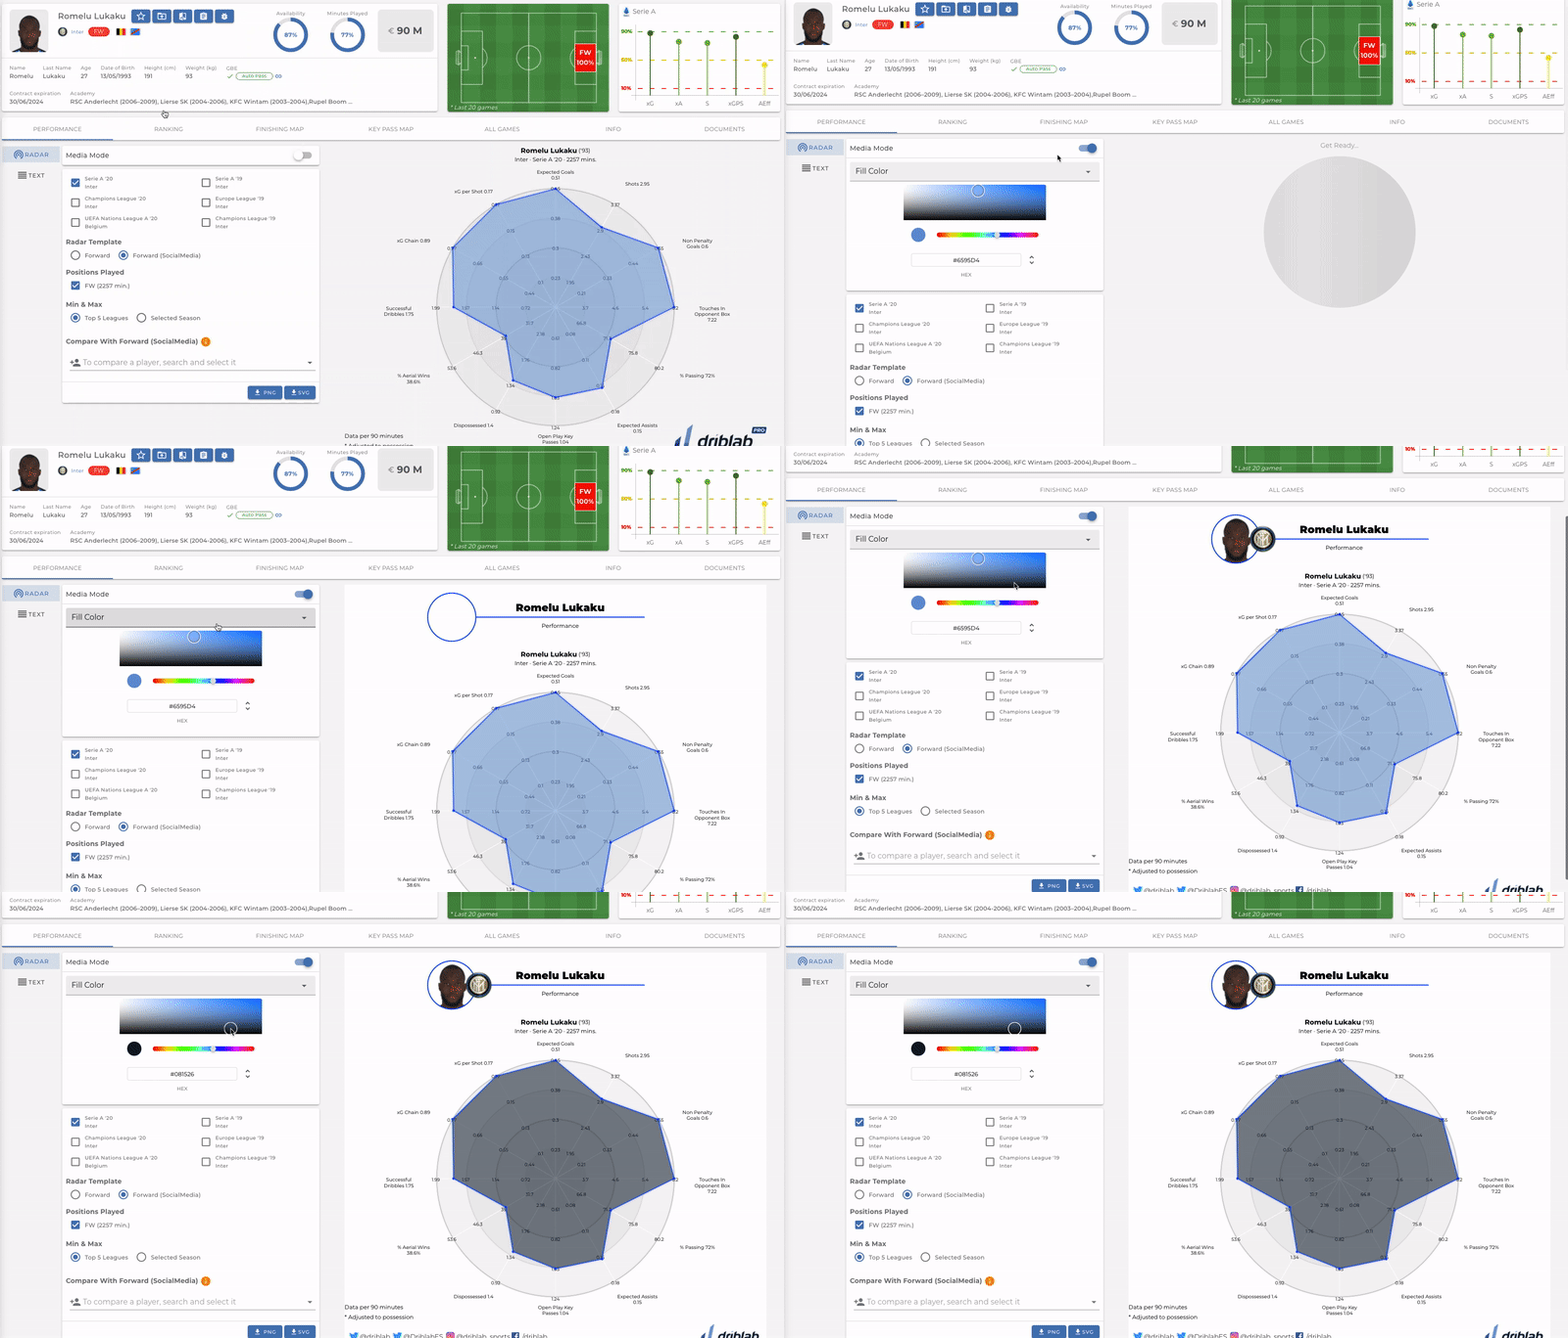
Media Mode (radars, game flow, xT chart)
This month we have enabled the Media Mode, which allows the user to edit any available graphic (finishing map, game flow, xT map…). With this customizable tool, the properties of the visualizations can variate on demand so as to display the desired sizes, texts or colors.
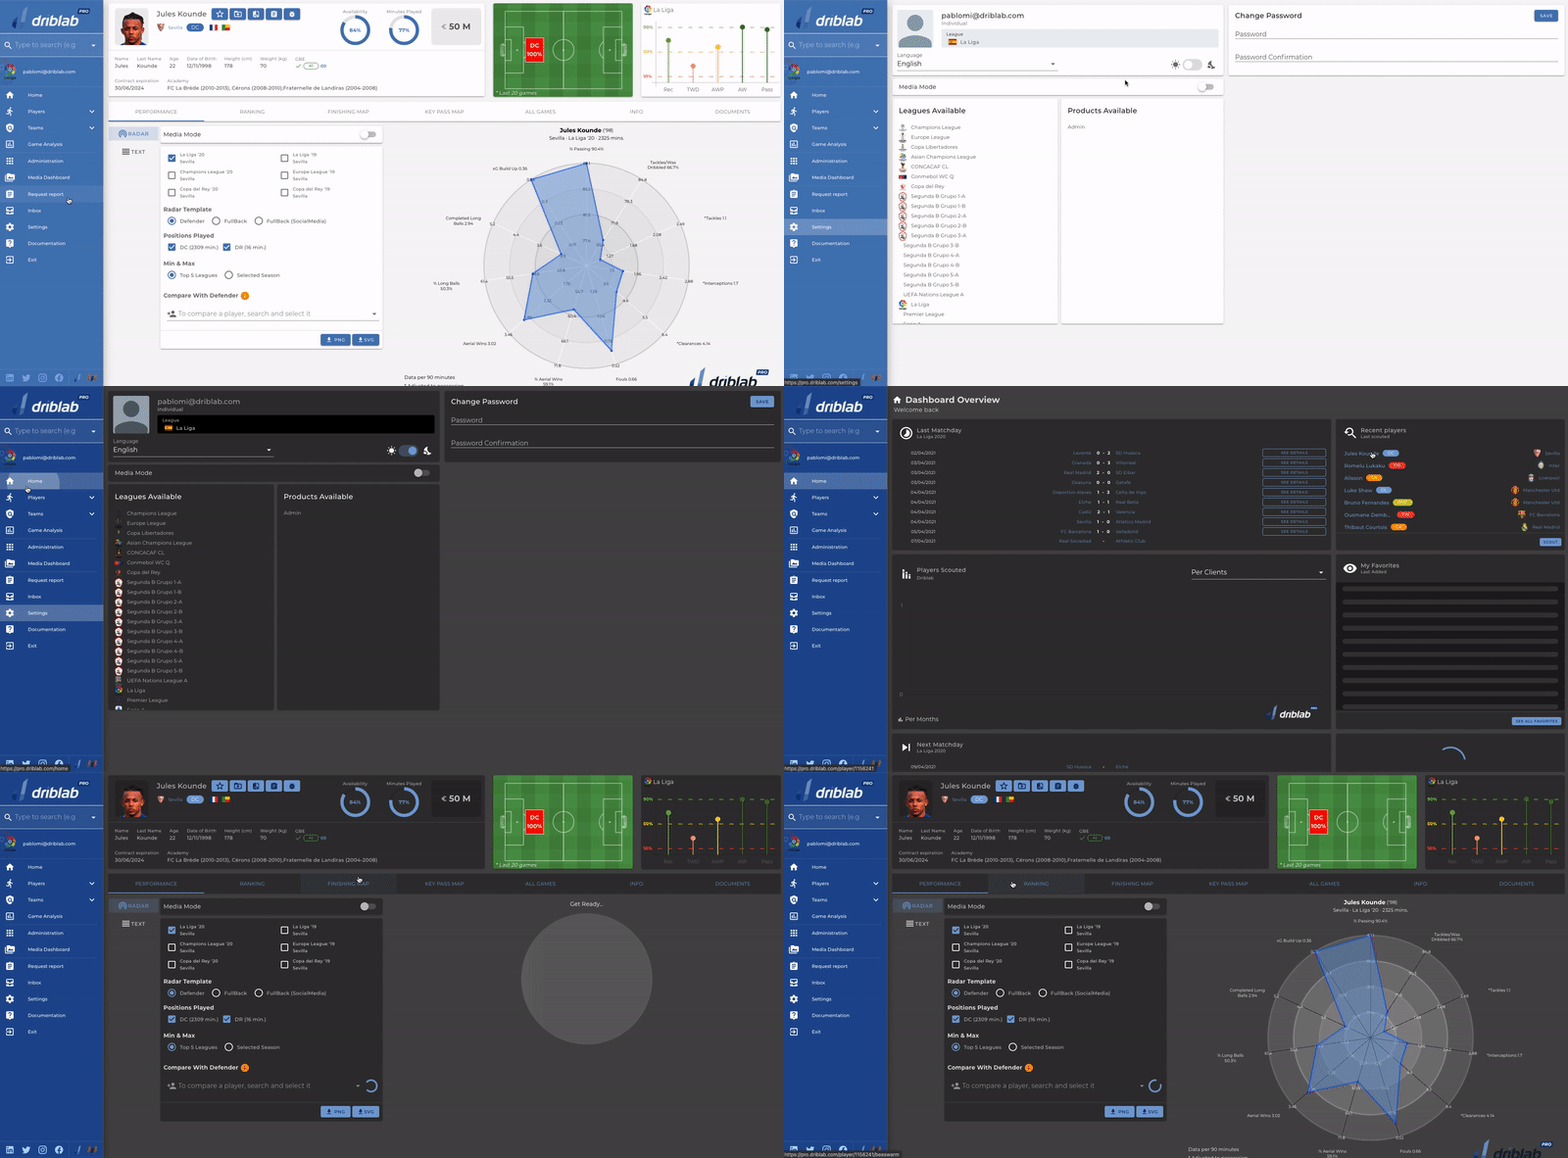
Improved Dark Mode
We have improved the dark mode to make the interface more night friendly. Colors were changed so those who spend more hours on the screen feel more comfortable. Users simply need to enable it in the settings panel.
We are Driblab, a consultancy specialized in the statistical analysis of players and teams; our work is focused on advising and minimizing risk in professional football decision-making in areas related to talent detection and footballer evaluations. Our database has more than 180,000 players from more than 180 competitions, covering information from all over the world. Here you can learn more about how we work and what we offer.
