
Following the match, managers and analysts carry out the process of understanding what was correctly done and what was incorrectly executed. Today at Driblab we present a new feature that will allow to figure out in an easy, comprehensive approach the best and worst practices of the team during the match duration.
Looking back at yesterday’s UEFA Champions League matches, Real Madrid beat Jurgen Klopp’s Liverpool 3 to 1. Zinedine Zidane looks forward to wrap up the semifinals in Anfield. In Manchester, the Citizens won 2 to 1 against Borussia Dortmund after a late goal in the 90’ by Phil Foden. With all chances open for the second match, Erling Haaland will be looking to make the difference and win the tie.
So in today’s article we will explain how this new tool can help users to understand what happened yesterday. Through a step-by-step process, the user will not be overwhelmed by the number of figures available, making it easier to understand. The three initial steps of the tool are the Finishing Map, the Key Pass Map and the Game Flow.
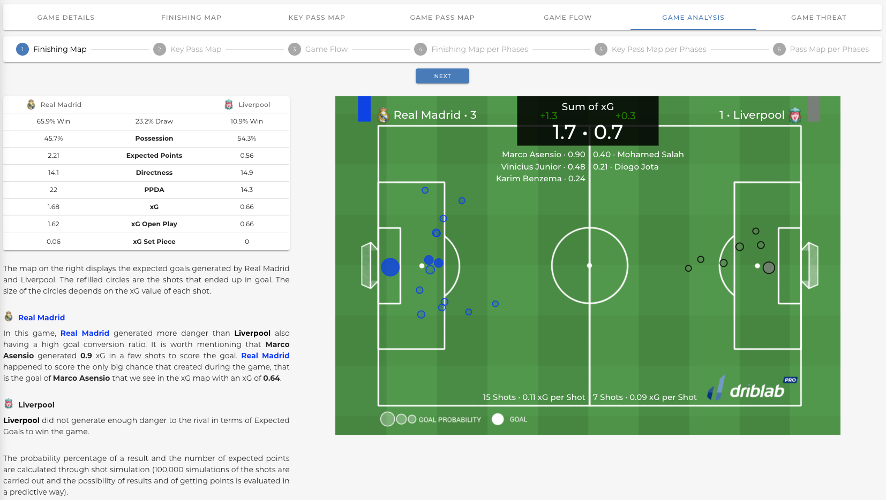
On the first step, altogether with the Finishing Map, overall statistics such as Expected Points or xG are supported by a short summary of each team performance regarding danger generation. Real Madrid victory was built on the higher danger generation, also having a good goal conversion ratio. Marco Asensio bundled most of the xG, being his goal on the 35’ the event with the highest xG of the match (0.64). Mohammed Salah, the Liverpool player with the highest accumulated xG (0.4), was even lower than the 2nd player from Real Madrid (Vinicius Junior with 0.48 xG).
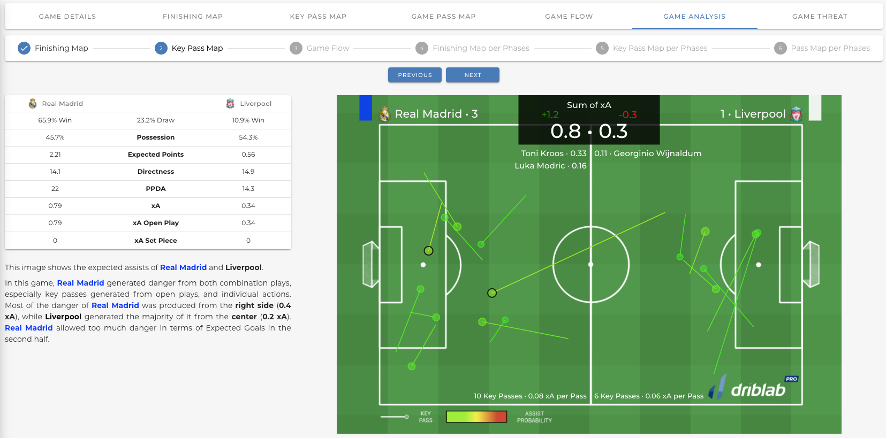
Following, the Key Pass Map is complemented by an analysis of the key passes per zones, differentiating between Open Play Assists and Set Piece Assists. Both assists from Toni Kroos and Luka Modric to Vinicius Junior ranked top on xA. It is interesting to highlight how key passes came from the sides for Zidane pupils while most of the Liverpool key passes were clustered in the center.
Next, the Game Flow step lets the user configure how many phases want to analyze and the time range of each one. 4 phases will be set by default. On each phase, the Game Flow is analyzed looking at % of possession of each team, Expected Threat generation and passes delivered into the final third of the pitch.
Taking a look at the first half of the match, Real Madrid clearly generated more danger. However, it is interesting to note that despite generating the highest amount of expected threat (xT) on the first 25 minutes and a higher number of passes in the final third of the field (52), they xG was much higher on Phase 2 when Real Madrid had less possession, lower xT and only 21 passes in the final third.
On the 4th step, the Finishing Map is analyzed, again, per customizable phases. The feature explains the user which team generated the highest xG on each phase and why. Several metrics such as Directness, Possession or PPDA are also considered to understand who performed better on each time window.
During the first phase of the match (1’ to 25’) Real Madrid only generated 0.17 xG in open play, and Liverpool did not generate. xG at all. While Real Madrid improved it in the next phase (26’ to 47’) reaching a total xG in open play of 1.08, Liverpool generation was 0 again.
PPDA values for both teams were above 20 in the first phase (meaning both teams left room for passes before recovering the ball) while on the following minutes, both metrics went down to 12.9 and 12 passes respectively (recovering the ball quicker). On the second half, Real Madrid danger generation was almost tied to Liverpool’s on the first 25 minutes, while in the last phase of the match they did not generate any xG. Nevertheless, Liverpool was not able neither to generate real danger to Thibaut Courtois.
On the 5th step, the tool studies the different selected phases regarding the Key Pass Map. Which team had more the ball, quantity of passes, who played more directly or how many chances were created are figures considered when the feature draws a conclusion about each phase.
The Reds, surprisingly, were not able to generate a chance in the first half despite having the ball for more minutes in the overall, while Real Madrid managed to create 5 chances. The starting of the 2nd half was not different in terms of xA. Liverpool was again outperformed, despite of the Salah goal, on the chances generation.
On the last 20 minutes of the match, despite having an overwhelming quantity of 97 passes in the final third of the field (close to Courtois goal) and a 65% of ball possession, this sterile dominance was not converted into real chances. It is also interesting how the directness on the Real Madrid gameplay got higher on this last phase of the match.
Last but not least, the tool analyzes the pass map on each phase of the match. Passing percentages, xA per player and percentage of xT generated of the team are considered. Toni Kroos sharply performed 100% (24), 81% (11), 90% (20) and 80% (20) of good passes respectively on each phase, rarely reachable numbers on Champions League matches.
Another remarkable point is the evolution of the player position. During the first half of the match, Benzema stepped closer to Vinicius during the first 25’ while he moved next to Marco Asensio on the second phase of the match. On the second half of the match, the French forward stayed more centered on the field.
We are Driblab, a consultancy specialized in the statistical analysis of players and teams; our work is focused on advising and minimizing risk in professional football decision-making in areas related to talent detection and footballer evaluations. Our database has more than 180,000 players from more than 180 competitions, covering information from all over the world. Here you can learn more about how we work and what we offer.


