
In our quest to simplify something as complex as comparing the performance of all teams in a league or continent into one picture, in recent weeks we have launched our ‘beeswarm’ visualisation for teams, where you can access all team metrics, separated by style, offensive and defensive, and see which teams are leading in one or more stats and which are above or below average.
To get into the realm of comparison, this visualisation is very useful as it is easy to see how a team is performing in that facet and which teams are setting the bar. Filtering by a single league or a group of championships that might be interesting to contextualise more precisely, we quickly find a complete picture of many teams in a single image, and we can always use the question how far behind the best am I?
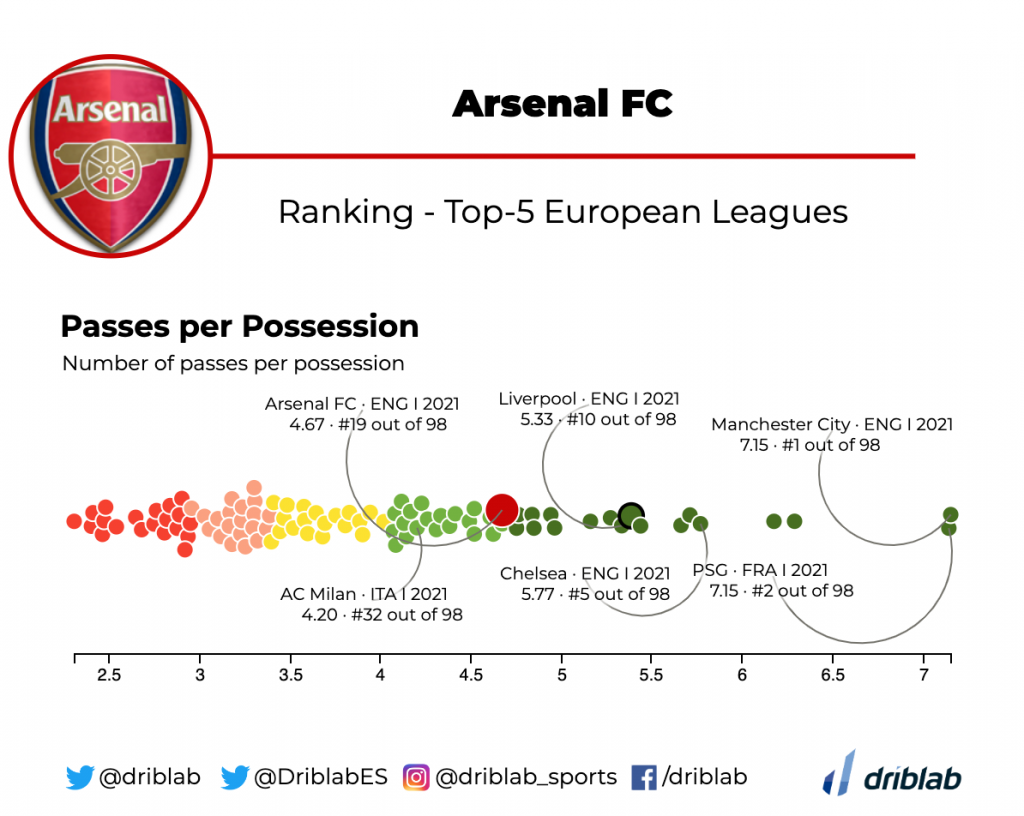
Using concrete cases, one of the young projects in Europe that is trying to regain its status with time and patience is Mikel Arteta’s Arsenal, an attack-minded team with very vertical players and a coach who wants to elaborate the game… to a certain extent, albeit to a certain extent. Knowing this, how elaborate are Arsenal’s attacks, are they a patient team or do they prefer to attack in a few touches? With the Passes per possession metric, we can find out how many passes a team makes, on average, per possession and where they rank in relation to their competitors in the big five leagues. The gunners, on average, with 4.67 passes per possession.
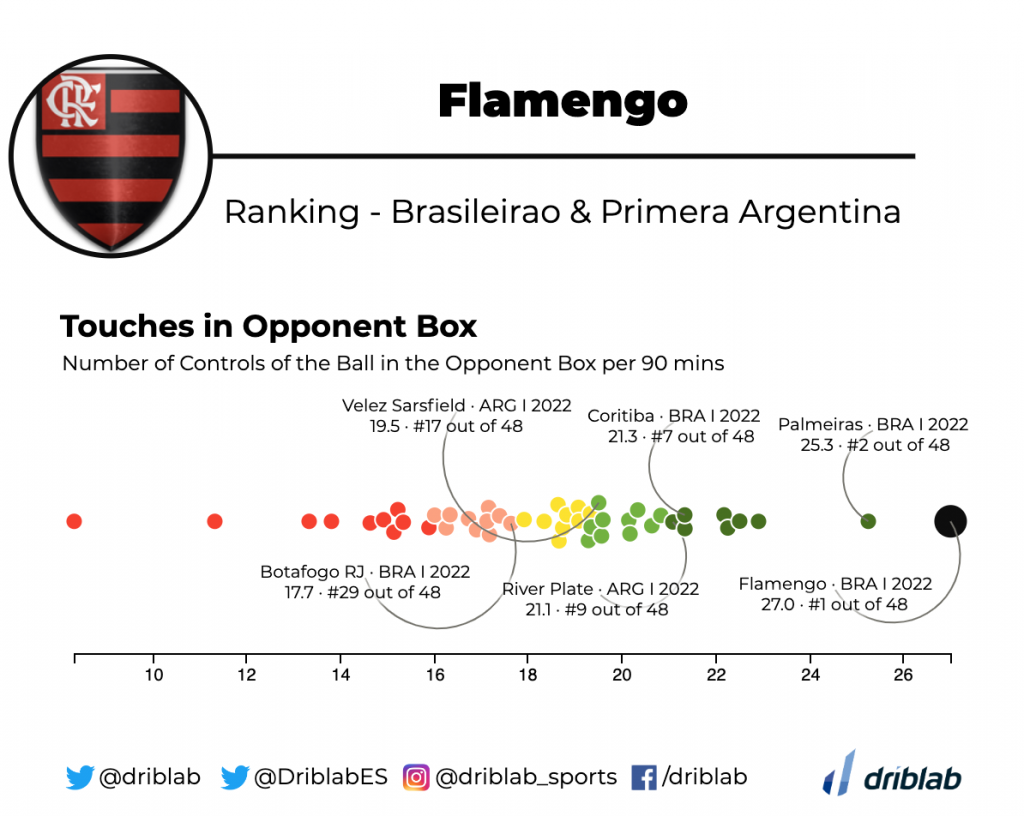
If we wanted to find the deepest team in the Brasileirao 2022 and Primera Argentina 2022, we could pick several stats, but a good way to do it with just one is to look at how many touches in the opposite box per 90 minutes the teams have. There we would find the almighty Flamengo as the standout leader, but at the same time we could find how far behind the next and where each team in both leagues ranks in this statistic, being able to find out how many touches in the box River Plate, Palmeiras or any team we want to measure.
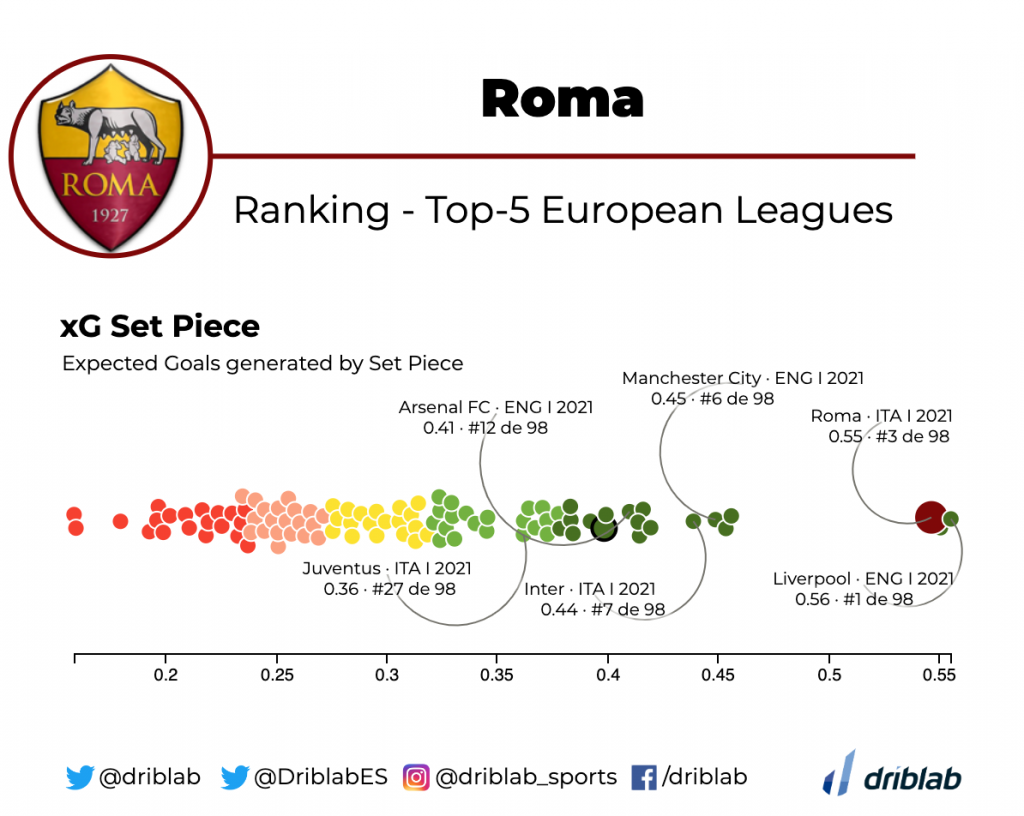
Let’s use one last example: which teams generate the most Expected Goals (xG) from set pieces and how they are performing against teams in their league or a group of leagues. All season, José Mourinho’s Roma have emerged as the leaders, not just in Serie A but in all top five leagues, but it is Liverpool, with the ability of Van Dijk, Matip or Konaté, to generate the most xG set piece per 90 minutes.
All our clients have access to visualisations such as these with which to analyse all kinds of statistics and, at the same time, compare and contextualise with their competitive environment.
We are Driblab, a consultancy specialized in the statistical analysis of players and teams; our work is focused on advising and minimizing risk in professional football decision-making in areas related to talent detection and footballer evaluations. Our database has more than 200,000 players from more than 180 competitions, covering information from all over the world. Here you can learn more about how we work and what we offer.


