‘Trends’: measure how your next rival is competing

Category: Team Analysis

We delve into different competitive statistics that explain how your next opponent is performing.

Published:13/04/2023

In the preliminary analysis of an opponent there are a multitude of factors to take into account. Many of them have to do with the principles of play and the football traits that define them, their tactical formation or set pieces, but there are others that do not respond to a stylistic performance but to a competitive response within the matches. In driblabPRO, the analysis platform for clubs and football professionals that we have developed at Driblab, we have compiled information on specific trends that explain how a team behaves in different competitive situations.

This text is a continuation of ‘How to use driblabPRO as a club analyst‘ which you can see here.

For example, did you know that Chelsea in the 22/23 Premier League have only been ahead 23% of the time, or that Atletico Madrid have scored 15 goals in the first half and 29 in the second half, or that Arsenal have been drawing 39% of the time? These are just some of the things we can see at the click of a button.

Streaks – Wins – Clean sheets

With ‘Streaks‘ we will know the streak of results of that team as a first filter to know their possible state of confidence and how they are in terms of dynamic results before facing the duel against our team. We can then find out who they have won against and how many of those wins have been at home or away, while we can also see how many clean sheets the opponent has had, who they have won against and whether they were at home or away. All information is relevant to get a complete picture.

Goal Periods

Dividing the two halves of the match into four time periods (Before 25′ / After 25′ / Before 70′ / After 70′) we can find out, for example, that Chelsea have been drawing 53% of the time.

Comebacks

Is my next opponent able to come from behind? If so, how often has it done so in a given season or competition? Although on this occasion the context is very important and knowing what happened in each match (there may be expulsions), it does add information on their ability to compete better or worse when facing an adverse score.
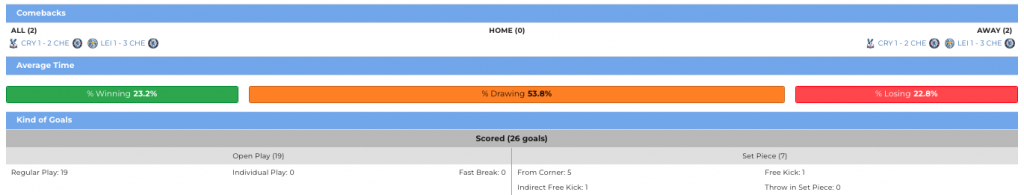
Average Time

With this functionality we can know how much time accumulated in the matches of a season or competition a team has been winning, drawing or losing, which tells us if it is a competitive team and does not suffer defeats or heavy scorelines that make it far from the points.

Types of Goals

Finally, although this information is found in the completion maps, it is collected at the end of the trends table to also know how the opponent scores their goals, their ability to generate goals from set pieces, on the counter-attack or in a play.

All this information is fully automated in all the leagues and competitions in which Driblab has coverage (more than 180 international and youth competitions).

Autor: Alejandro Arroyo
For Team Analysis we also recommend you:

Balkan U-20 talent not to be missed

Balkan U-20 talent not to be missed

No one misses more clear chances than… Erling Haaland.

It's no coincidence that the players who miss the clearest chances are often the ones who score the most goals. It makes sense because their teams allow them to face higher-value chances more frequently, and therefore easier to convert. But this 2023-24 season is...

Driblab continues its business growth with the arrival of new key members

Driblab continues its growth with the arrival of new profiles

Club Atlético Peñarol and Driblab signs partnership agreement

Club Atlético Peñarol and Driblab signs partnership agreement

Driblab and MARCA: ‘Tactical Fouls’ and how to find them with data

In our latest collaboration with MARCA, we tried to discover which teams have a greater tendency to commit tactical fouls in a premeditated way.

Offensive and physical perfomance in second halves: Who attacks and presses more after halftime?

Among other functionalities, statistics serve to contrast, reinforce, or deny the sensations that, as analysts, one may have of a specific reality. It is very likely that our perception, especially in a game as peculiar and random as football, may tell us that a...

The data reflecting Bayern’s evolution

Entre muchos factores que explican sus dudas, ¿era el Bayern un club para Tuchel?¿Era Tuchel el entrenador idóneo para el Bayern?

‘Style metrics’: 10+ pass sequences per 90′

We discover which teams complete the most +10 pass sequences in each match and which complete the least in the five major leagues, an interesting style metric for analysis.

Scouting beyond the second divisions: on-demand data and coverage

Four of Driblab’s last eight clients are in the lower to second divisions. This is how we help clubs all over the world with data and scouting.

On comebacks and goals after the 90th minute

For some time now, we have been incorporating additional valuable information into all our models and advanced statistical metrics, regarding the competitive dynamics of each team. We unveil which teams make comebacks more often and which score more goals in the final stretches.

Driblab

Información corporativa

Somos una empresa con sede en Madrid fundada en 2017 por Salvador Carmona y Cristian Coré Ramiro. Desde nuestros inicios nuestro trabajo se ha centrado en el análisis estadístico de datos para ayudar a los clubes en la planificación deportiva. Somos una consultora big data que ofrece servicios personalizados para cada cliente y defiende un modelo de gestión mixto y una comunicación constante para acompañar el día a día de las instituciones. Nuestro punto fuerte es la más amplia cobertura disponible en número de torneos profesionales y juveniles. Para más detalles, póngase en contacto con nosotros.

Colaboramos con:


Hemos aparecido en: