
Last week we presented one of our latest launches at driblabPRO, ‘Post-Game Analysis‘, a new tool with which you can analyse and evaluate the performance of a team after a specific game. In it, based on six steps and with different metrics, analysts and members of a coaching staff can assess into those aspects in which the team performed well and also those where the team made mistakes.
Let’s take advantage of the extraordinary Paris Saint-Germain Bayern UEFA Champions League quarter-final, in which Mauricio Pochettino’s side qualified for the semi-finals, to find out how both teams performed and what our new functionality tells us to draw some conclusions about the performance of the French and Germans.
With the Finishing Map we find a first general approximation of how each team materialised the chances generated and the expected goals and assists throughout the match. Especially remarkable was Neymar Junior, who almost single-handedly generated the expected goals for the Parisian team in the 90′. His were the best chances of the first half, with Neuer saving a great chance and the Brazilian crashing two balls against the goalposts.
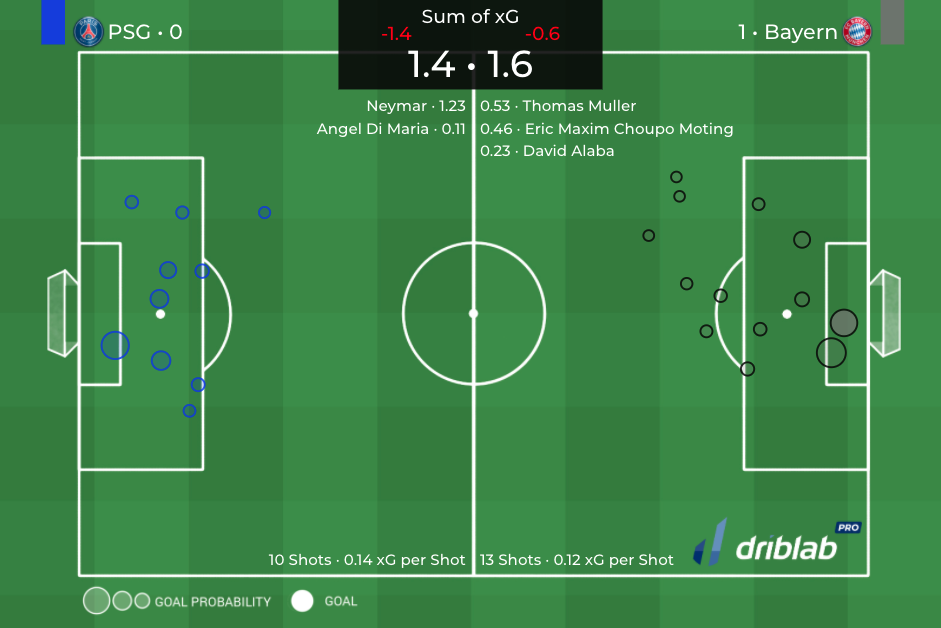
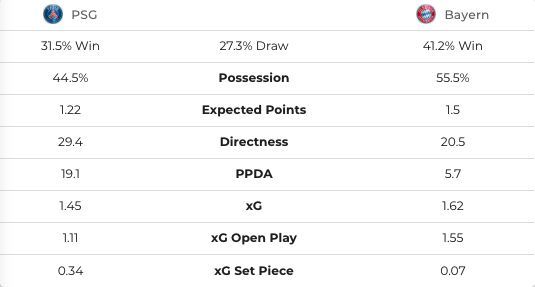
In this first step of the ‘Post-Game Analysis‘ tool we can also find some relevant aspects at a collective level, differentiating xG in play and xG at set pieces, as well as see the defensive attitude of the two teams in relation to the amount of passes the opponent made before applying intensity in pressing (PPDA). As was the case in the first leg in Germany, Bayern, displaying their high intensity, pressed before the sixth pass, while PSG held more position and did not attempt to harass or steal until after 19 passes on average.
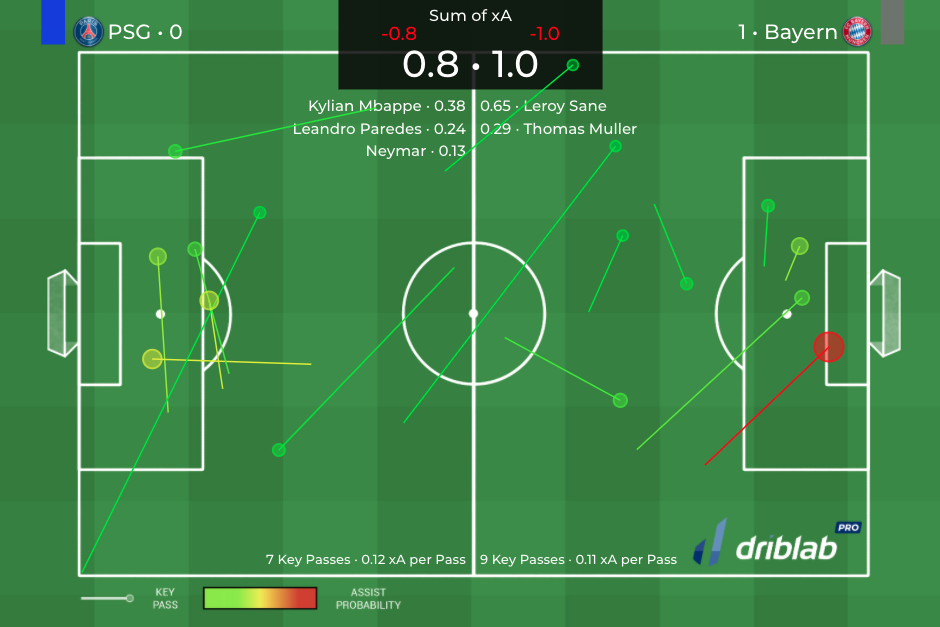
Alongside Neymar, it was Mbappé and Paredes who added to the creation of chances from expected assists (xA). This is reflected in the Key Pass Map, with which we can take into account from which areas and which players found space in attack and teammates in key positions to generate danger and quality finishes. In this statistic, the talents of Leroy Sané and Thomas Müller generated more than the whole of Paris Saint-Germain, perhaps noticing the absence of Robert Lewandowski in finishing.
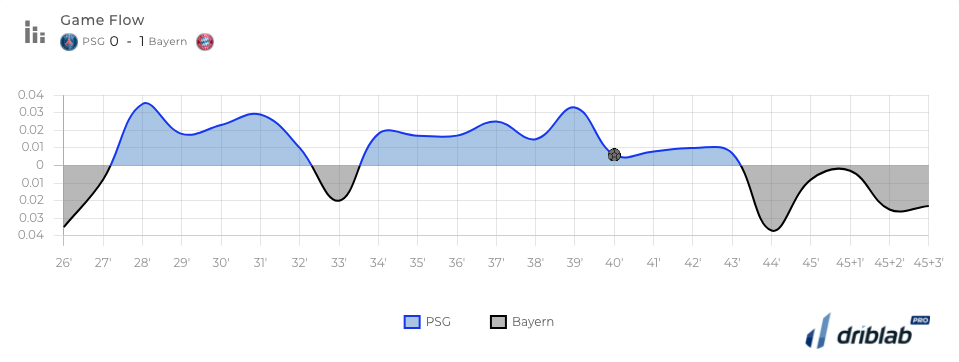
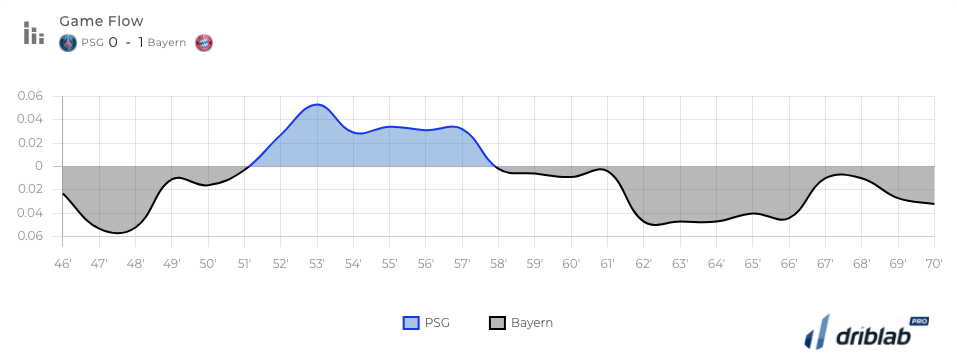
To complement and reinforce these feelings, it is essential to turn to the ‘Game Flow‘ tool, the third step in our analysis. Unlike the first leg, where Bayern dominated from start to finish, with hardly any phases of control and domination by PSG, this time the dominance was much more evenly divided. The ability of Neymar, Paredes and Di Maria to escape the Bavarian pressure meant that control of the game was much more evenly balanced, forcing Bayern to run back and restart their attacks further forward than usual.
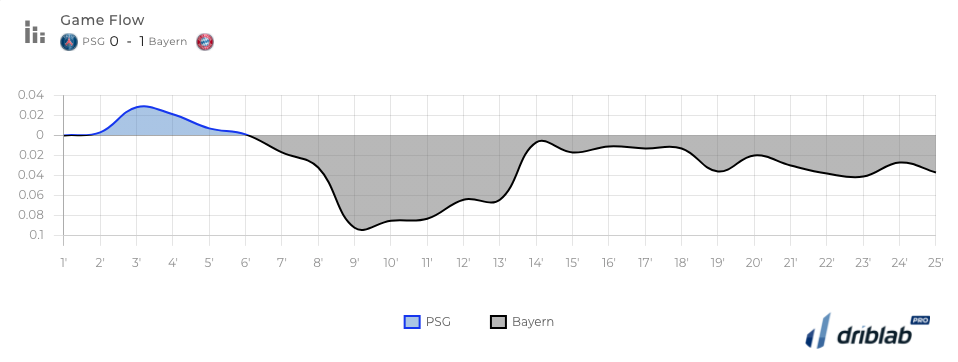
While in the first 25 minutes Bayern were able to impose their characteristic rhythm and shape, in the next 50 minutes Paris Saint-Germain were able to turn the situation around and start to make progress with the ball. However, in the French side’s most controlled period, Bayern took the lead, with Choupo-Moting scoring, and were just one goal away from qualifying for the semi-finals.
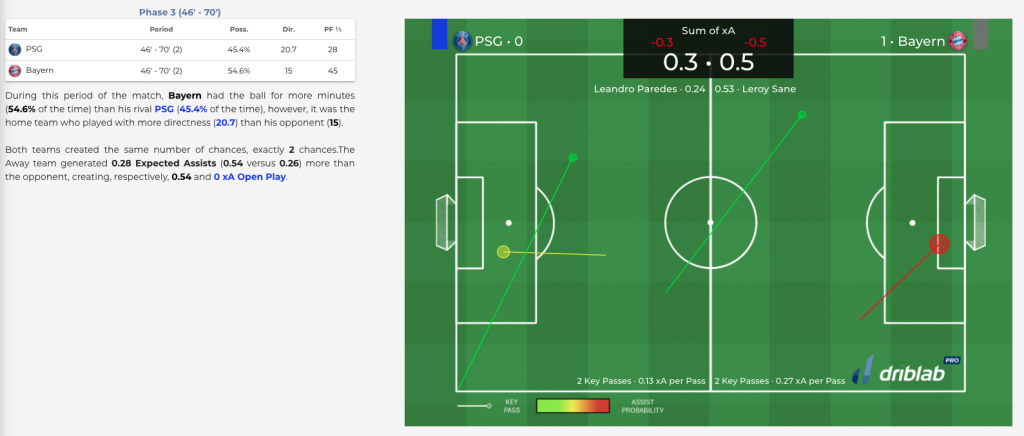
This same analysis by phases can be checked both in the Finishing Map by Phases and in the Key Pass Map by Phases. Complementing each phase in Game Flow with its corresponding phase in each Map by Phases, we can check whether this dominance translated into more generation and finishing or, on the other hand, as often happens, for example in the first leg at the Allianz Arena, it was unrelated and one of the two teams generated and finished despite being widely dominated.
It is always interesting and very illustrative to check the collective Pass Matrix in the Pass Map per Phases, both during the 90 minutes and divided by phases. If we use the passing matrix of both teams for the whole match, we can conclude not only the collective planning from the passing and the height of the pressure but also, in this tie, the offensive and defensive style of both teams. Paris Saint-Germain, by the ratio of their passing and the average position of their players, played much further back than their opponent, a once again dominant Bayern defending forward and winning the ball back from pressure, only giving ground when the quality of their opponents’ transitions forced them to drop back.
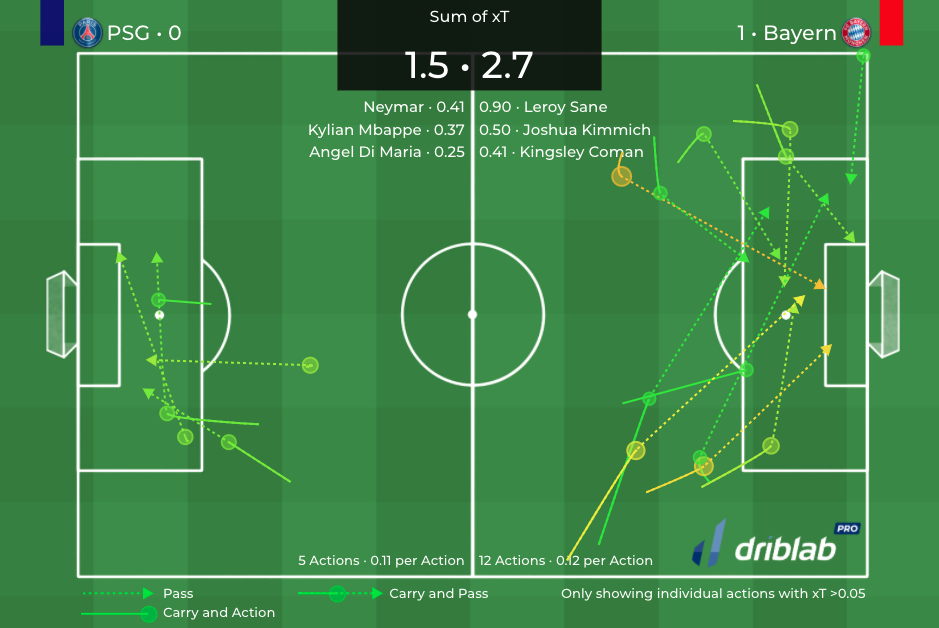
In this particular match, and finally, another of our driblabPRO metrics was also very illustrative: the xT or Expected Threat Map, which measures the threat generated, in which Bayern generated almost twice as much as the French champions, mainly through the classic moves and changes of rhythm of their wingers, Leroy Sané and Kingsley Coman.
We are Driblab, a consultancy specialized in the statistical analysis of players and teams; our work is focused on advising and minimizing risk in professional football decision-making in areas related to talent detection and footballer evaluations. Our database has more than 180,000 players from more than 180 competitions, covering information from all over the world. Here you can learn more about how we work and what we offer.


