Visualizing Liverpool’s problems

Category: Team Analysis

What data best reflects Liverpool's decline? They are not few and they are very obvious.

Published:23/02/2023

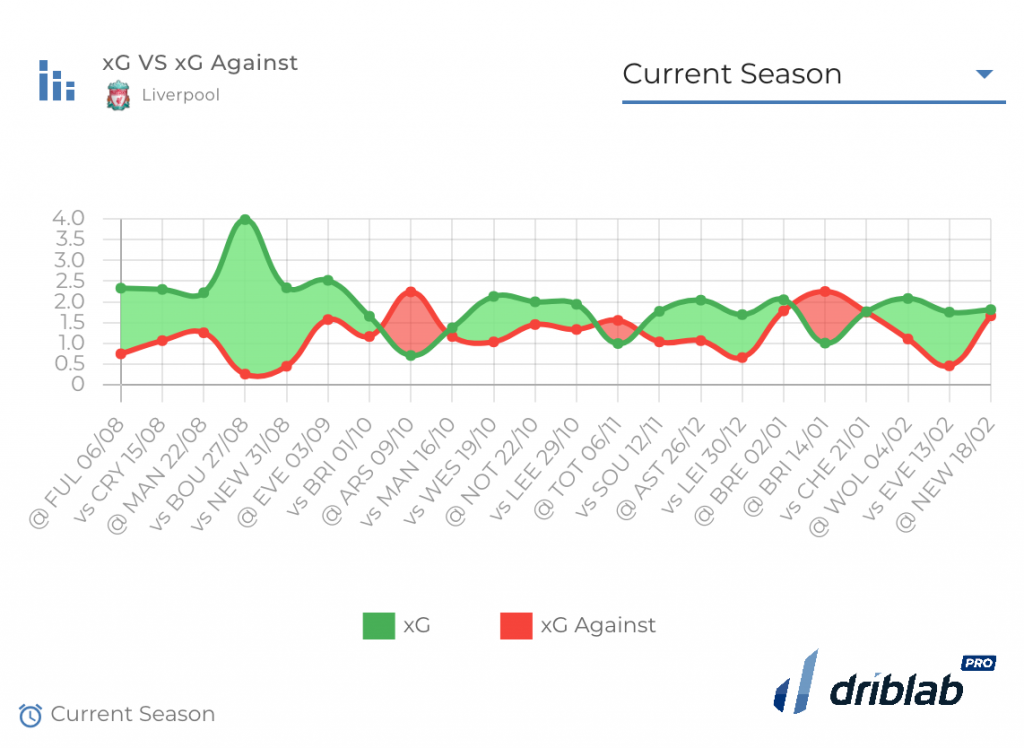
It wouldn’t have taken Real Madrid scoring five goals to reveal Liverpool’s problems but, in a way, it exposed them when they had generated just 1.3 expected goals to Jürgen Klopp’s side’s 2.2. That kind of game has become a habit for Liverpool this season and is one of the reasons behind their performance.

Liverpool 22/23: 1.93 xG per 90′ – Opponents: 1.23xG per 90′

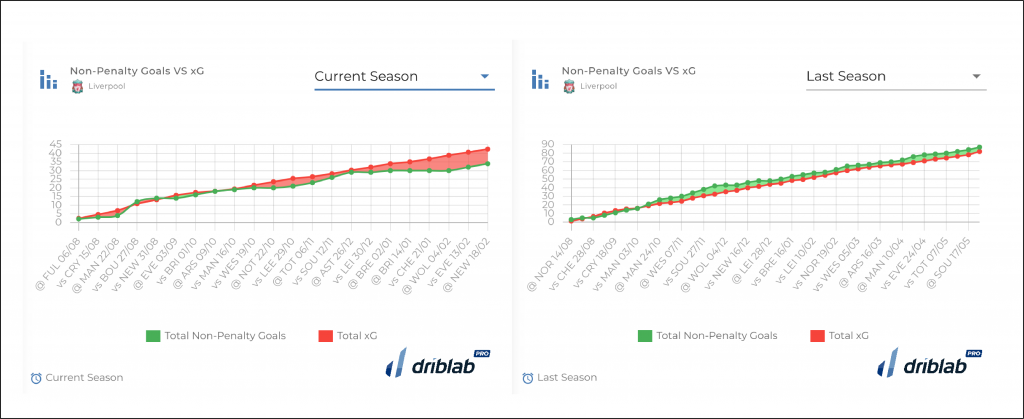
Injuries cannot be obviated in this equation, because it is top players who have missed too many games, as is the case with Van Dijk, Diogo Jota or Luis Diaz, but the issue goes beyond that. On the one hand, translating the expected goal dominance over the opposition into goals is costing them their status in the Premiership. In this double graph we see how this season, the expected goals exceed their goals, while last season it was always the other way around, their effectiveness was higher than what they generated. Something that is getting worse in the last ten games, with a difference between the expected and the actual too big.

And that is an indicator that a team is suffering wear and tear, especially mentally, seeing that results are no longer a certainty when chances are missed, even knowing that the scare value of chances is higher this season than last (0.12xG per shot, for 0.11).

If we compare their performance with their opponents, in only three Premiership games did they generate fewer expected goals than their opponents. Liverpool have lost the ability to restart attacks by recovering quickly, suffering many transitions against, which, moreover, are converted into goals much more easily than the ‘red’ team itself.

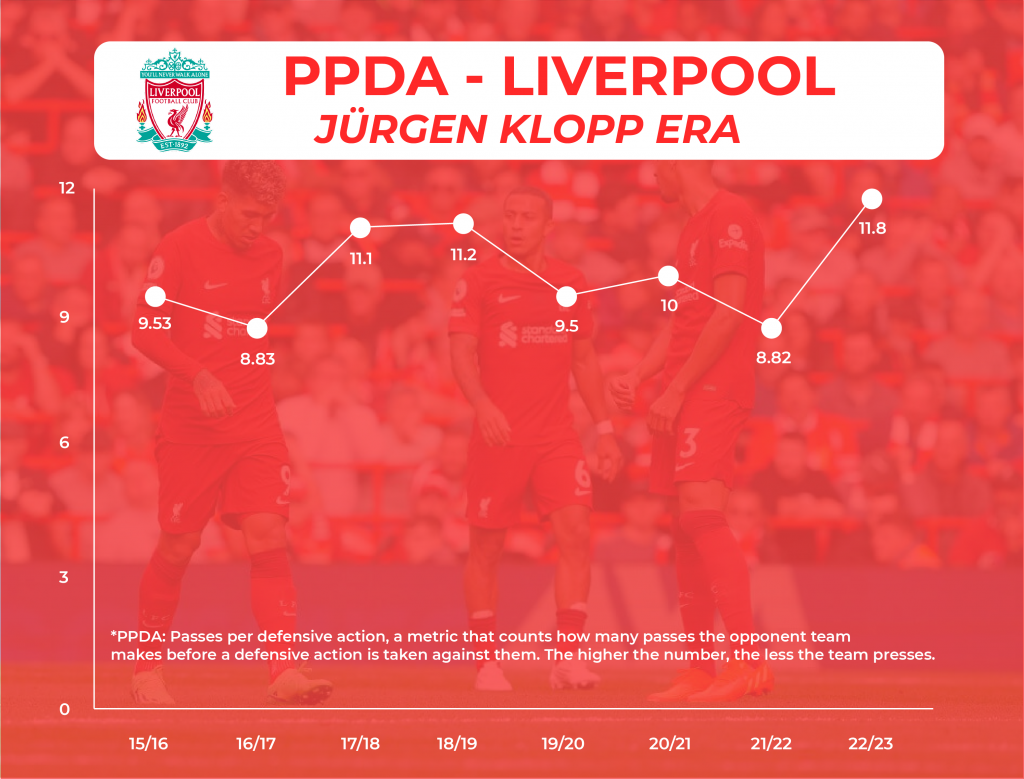
And it is behind all that appears their rhythm in the pressure. It is no coincidence that Liverpool is in the season, of all those that make up the cycle of Jürgen Klopp (more than 8 seasons), in which they are pressing less. Without making so many differences in this circumstance and without so much effectiveness in attack, the performance line declines and the scoring rate ends up being much lower, even more so in a Premier League where more and more teams are raising the level and wanting to settle in the elite of English football.

We are Driblab, a consultancy specialized in the statistical analysis of players and teams; our work is focused on advising and minimizing risk in professional football decision-making in areas related to talent detection and footballer evaluations. Our database has more than 200,000 players from more than 180 competitions, covering information from all over the world. Here you can learn more about how we work and what we offer.

Autor: Alejandro Arroyo
For Team Analysis we also recommend you:

Offside: teams that cause offsides most often

We analyze the teams that cause the most offsides and whether it is related to the way they defend.

Championship: Best U-22 centrebacks in defensive duels

Winning a duel is fundamental in football. We try to find out which U-22 Championship centrebacks are the best in ground and aerial duels.

Sky Sport Italy: the best goalkeeper claiming crosses

Sky Sport measures Milan’s two goalkeepers on their ability to get out to claim crosses, with Mike Maignan the best goalkeeper in Europe in that regard, thanks to our ‘Aerial Accuracy’ metric.

Counterpressing in Bundesliga 22/23

We display the defensive actions measuring pressure after loss across players and teams of the Bundesliga 22/23.

ON/OFF: Betis and Atlético de Madrid without two of its pillars

We look at the impact Nabil Fekir and Reinildo Mandava have on their respective teams, now that they are set to be sidelined for several months with the same injury.

GBE: South American U-20 talents now eligible to play in the UK

There are not many U20 talents in South America who can play in the UK. We look at some of the best who can do so by meeting the requirements set by the GBE filter.

Five years of VAR: are more penalties being awarded?

We go to our database to find out what impact VAR has had on penalties awarded since its inception.

How to use driblabPRO as a team analyst

We use numerous visualisations that the Driblab team has developed over time to facilitate the work of an analyst within a club.

driblabPRO Release Notes December ‘22

In recent weeks we have improved the speed of driblabPRO to offer a more dynamic experience to our users.

Iraola’s rules on the most difficult pitch in Europe

We analyse how Rayo’s game changes when they play at home and when they play away, making their stadium the most difficult in the top leagues.

Driblab

Información corporativa

Somos una empresa con sede en Madrid fundada en 2017 por Salvador Carmona y Cristian Coré Ramiro. Desde nuestros inicios nuestro trabajo se ha centrado en el análisis estadístico de datos para ayudar a los clubes en la planificación deportiva. Somos una consultora big data que ofrece servicios personalizados para cada cliente y defiende un modelo de gestión mixto y una comunicación constante para acompañar el día a día de las instituciones. Nuestro punto fuerte es la más amplia cobertura disponible en número de torneos profesionales y juveniles. Para más detalles, póngase en contacto con nosotros.

Colaboramos con:


Hemos aparecido en:


Talk to our speciali